Loading market data...
Fri, 25 Sept 2026
11:45:08 pm
Fri, 25 Sept 2026
11:45:08 pm

Rudransh Sangwan
Published at: September 25, 2026, 7:26 AM
Synopsis
Shanti Gold International shares trade at Rs 319.57 with 27.21% one year returns. Read its June 2026 results, expansion plans and valuation.
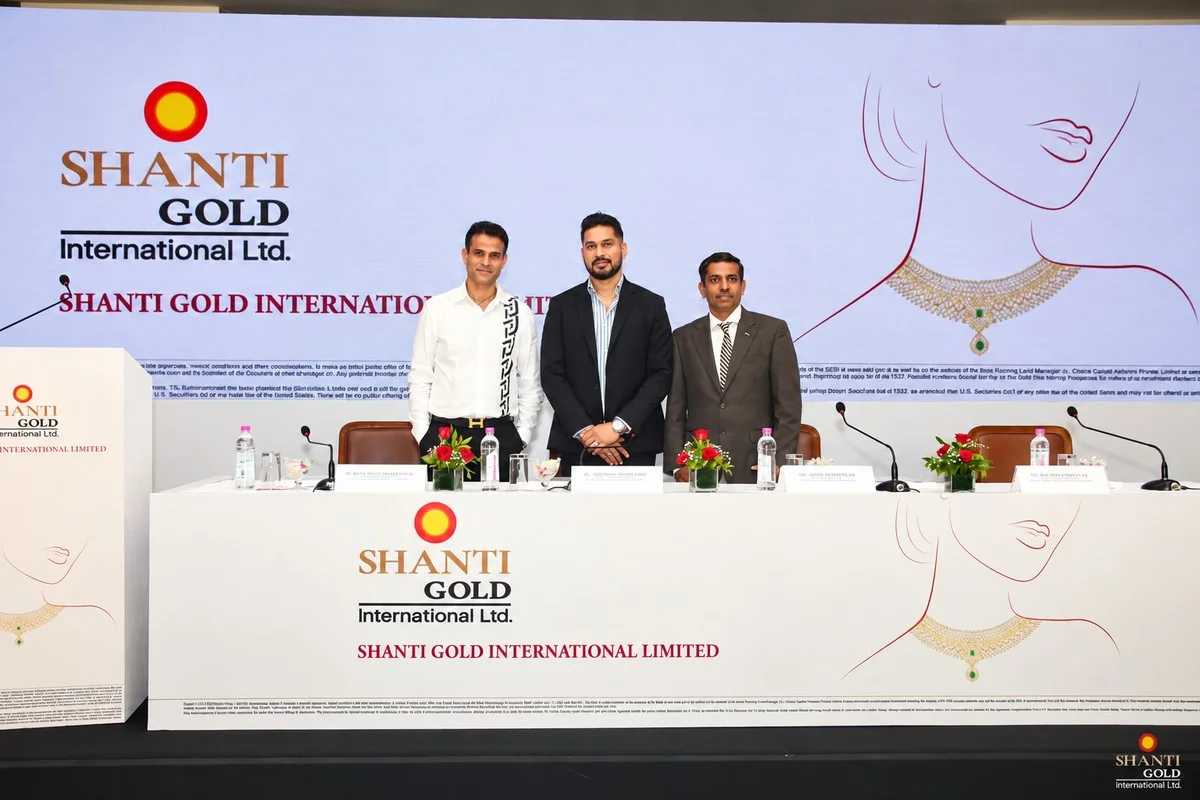
Shanti Gold International's share price stood at Rs 319.57 on September 25, 2026, while its market capitalisation was Rs 2,176.48 crore, based on the supplied market data. The stock has gained 27.21% over the past year and 60.86% over six months.
The company has also reported higher operating numbers in the June 2026 quarter. Revenue reached Rs 718.06 crore, while net income stood at Rs 50.49 crore. The quarterly figures show continued growth in sales and profitability compared with June 2025.
The supplied data contains a price inconsistency that readers should note. It lists the September 25 share price at Rs 319.57 but separately gives a 52 week high of Rs 293.70. Since the current price is above that stated high, the high and low figures may come from different data timestamps.
Loading chart...
Shanti Gold International has recorded positive returns across most of the periods provided. The stock gained 15.62% in one week, 3.12% in one month, 28.21% in three months and 60.86% in six months. Its one year return was 27.21%, while the supplied five year return was 23.75%.
The recent movement has come alongside improved financial performance. The company recorded four consecutive quarters of positive results, with June 2026 sales reaching a record level in the supplied company data.
The stock's recent movement can also be viewed alongside broader Indian market conditions. WeloMoney's earlier coverage of recent Indian stock market moves provides wider market context, while Saregama India's share price move shows how company specific earnings can coincide with large stock price movements.
Shanti Gold International's June 2026 quarter showed higher revenue and operating profit compared with the June 2025 quarter. Total revenue rose from Rs 293.93 crore to Rs 718.06 crore, while EBITDA increased from Rs 52.56 crore to Rs 73.13 crore.
Net income was Rs 50.49 crore in June 2026, compared with Rs 34.35 crore in June 2025. EPS stood at Rs 7.00 for the June 2026 quarter.
| Particulars | June 2025 | March 2026 | June 2026 |
|---|---|---|---|
| Total revenue | Rs 293.93 crore | Rs 662.32 crore | Rs 718.06 crore |
| EBITDA | Rs 52.56 crore | Rs 70.40 crore | Rs 73.13 crore |
| PBIT | Rs 51.14 crore | Rs 68.71 crore | Rs 70.94 crore |
| PBT | Rs 45.89 crore | Rs 64.26 crore | Rs 65.26 crore |
| Net income | Rs 34.35 crore | Rs 51.93 crore | Rs 50.49 crore |
| EPS | Rs 6.36 | Rs 7.86 | Rs 7.00 |
The company had also reported net sales of Rs 716.38 crore for the June 2026 quarter in the supplied company and market material. The difference between that figure and total revenue of Rs 718.06 crore reflects the use of different financial measures.
Shanti Gold has been expanding its manufacturing capacity. The Marol facility in Mumbai started operations in June, while a Jaipur facility was planned for commissioning later in 2026. Management has also discussed new designs and higher volumes as part of its growth plans.
The company had reiterated guidance for roughly 30% to 40% volume growth and 50% to 60% value growth. It also expected capacity utilisation to improve as new production lines became operational.
Management has pointed to operating leverage as another factor that could support margins as the new capacity is used more fully. These are management expectations, not confirmed future results.
The company also approved a rights issue of up to Rs 100 crore. The stated purpose was to fund gold inventory and working capital while limiting the need for materially higher borrowings.
One factor behind the reported profitability requires attention. The company changed its inventory accounting approach from FIFO to weighted average cost, or WAC.
The change created an unrealised inventory gain during a period when gold prices were moving within a relatively narrow range. The supplied company material said this had a positive effect on reported margins.
Management also indicated that such an inventory related gain was not expected to recur in the same way if gold prices remained within a narrow range. This means reported margins need to be viewed alongside the underlying operating performance.
Another issue highlighted in the supplied material was cash flow. Shanti Gold has had negative operating cash flow over the past four to five years, with working capital requirements remaining an important part of the business.
The supplied data shows a price to book ratio of 3.64 times, compared with a sector price to book ratio of 5.47 times. The sector price to earnings ratio was listed at 25.90 times.
Another supplied analysis put Shanti Gold's trailing twelve month P/E ratio at 11 times and price to book ratio at 3.31 times. These figures appear to come from different dates or datasets, so they should not be treated as a single current valuation snapshot.
The company recorded a five year sales CAGR of 55.50% and EBIT growth of 84.96% in the supplied analysis. Average ROCE was listed at 17.35%, while average ROE was 32.22%.
Debt related figures also require attention. Average net debt to equity was reported at 1.44 times, while debt to EBITDA stood at 2.38 times. Interest coverage was listed at 9.07 times.
The supplied technical data shows the stock trading above its five day, 20 day, 50 day, 100 day and 200 day moving averages. Weekly MACD, Bollinger Bands and KST indicators were described as positive.
At the same time, the weekly Dow Theory signal and On Balance Volume indicator were described as mildly bearish. This means the technical picture was not uniform across all indicators.
The supplied material also said that RSI did not show a clear signal, meaning the indicator was not then indicating an overbought condition.
Because technical indicators can change with daily price and volume movements, these figures should be treated as a snapshot rather than a permanent signal.
For Shanti Gold International, several operating figures will matter as the company adds capacity and works to increase volumes.
The next financial updates should provide more information on whether higher capacity is translating into higher sales and operating profit, and whether cash generation improves alongside earnings.
Shanti Gold International operates in the precious metals sector, with activities including gold trading, refining and related services in India. The company is classified under the Consumer Discretionary sector and Precious Metals, Jewellery and Watches segment in the supplied market data.
The company's recent strategy has focused on expanding manufacturing capacity, increasing volumes and serving higher value demand through new designs. Its financial results and cash flow will provide further evidence of how the expansion is progressing.
Shanti Gold International's supplied share price for September 25, 2026 is Rs 319.57. The same supplied data lists a market capitalisation of Rs 2,176.48 crore.
Shanti Gold International's supplied one year return is 27.21%. The stock gained 60.86% over six months and 15.62% over one week in the same dataset.
Shanti Gold International reported Rs 50.49 crore of net income in the June 2026 quarter. The supplied financial table shows net income of Rs 34.35 crore in June 2025.
Shanti Gold International's total revenue was Rs 718.06 crore in June 2026, compared with Rs 293.93 crore in June 2025. Separately, the supplied company material reported net sales of Rs 716.38 crore for the quarter.
Shanti Gold International is expanding manufacturing capacity, with the Marol facility already operational and Jaipur commissioning planned for later in 2026. Management has also reiterated volume growth guidance of about 30% to 40% and value growth guidance of 50% to 60%.
Financial journalist specializing in market analysis, stock research, and investment trends. Dedicated to providing accurate, timely insights for informed decision-making.
Credentials: Experienced financial journalist with expertise in equity markets and economic analysis
The information provided in this article is for educational and informational purposes only and should not be construed as financial, investment, or legal advice. welomoney does not provide personalized investment recommendations.
For detailed terms and conditions, please read our Disclaimer and Terms of Service.
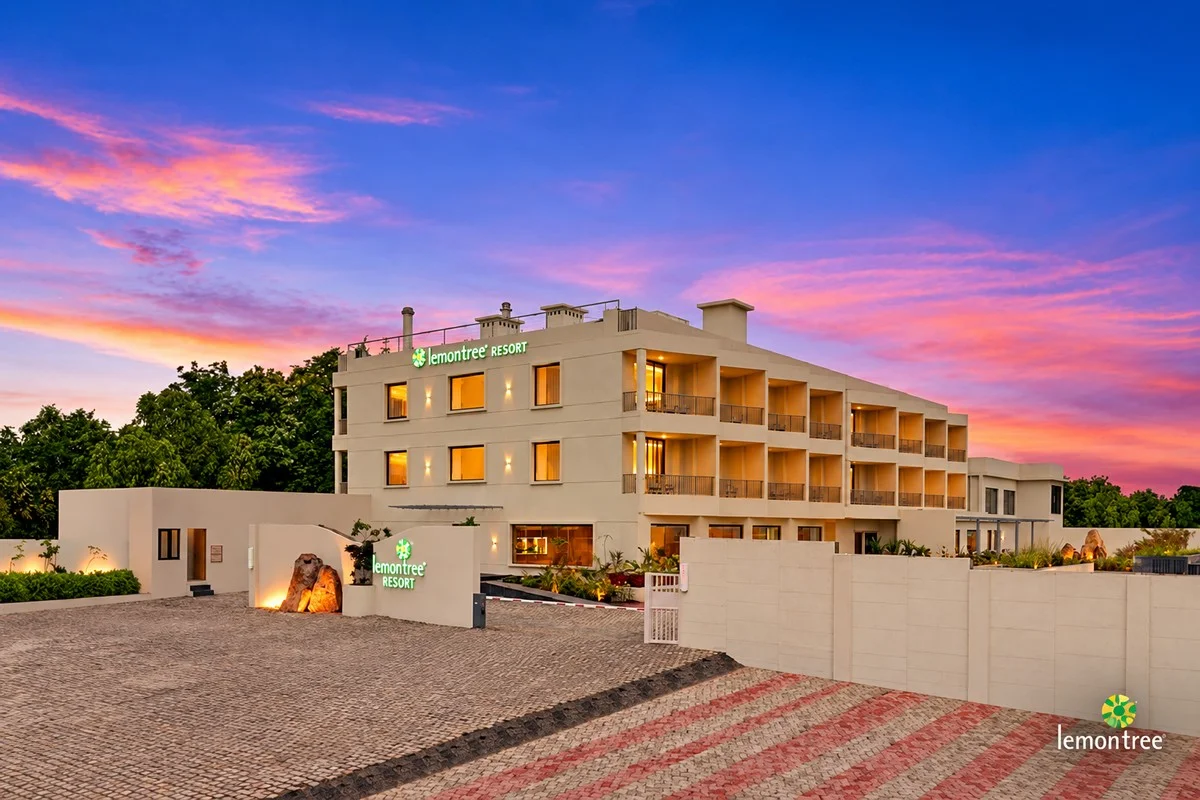
Lemon Tree Hotels will develop a 172 room Bandra hotel after buying land for Rs 120 crore, while a new 90 room Patancheru hotel expands its Telangana...
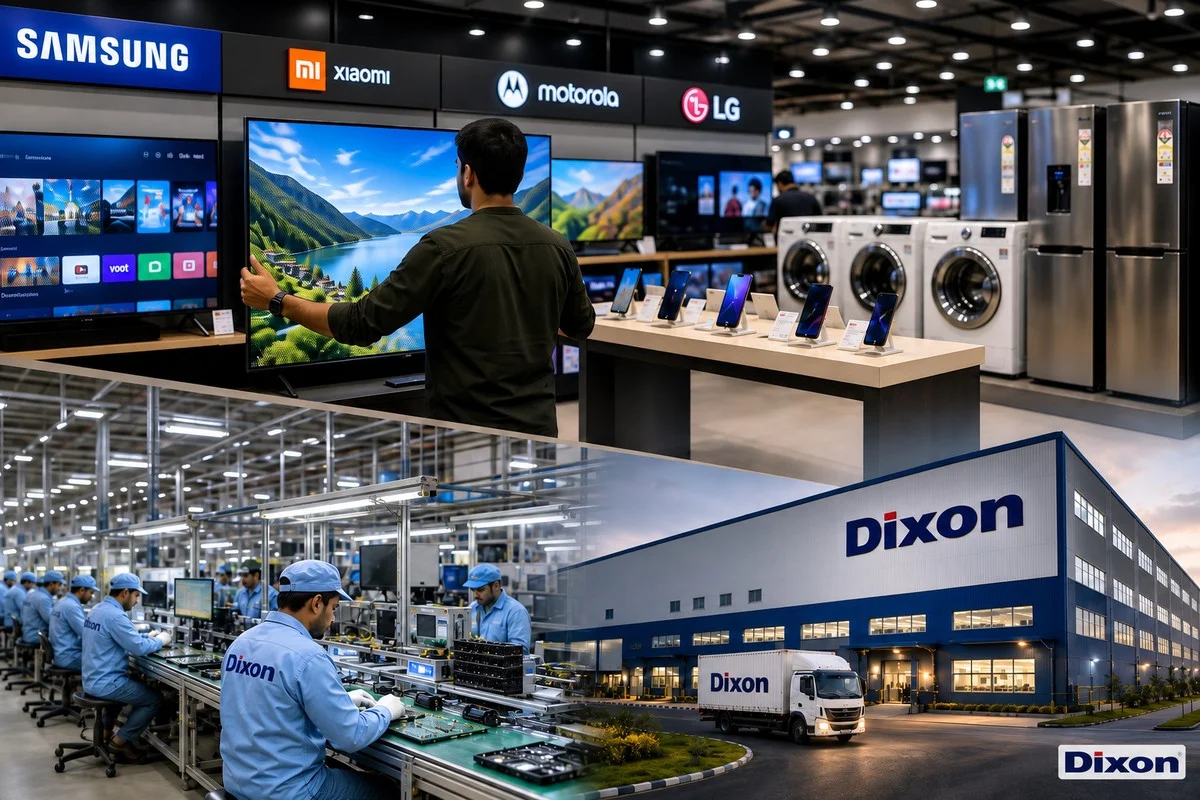
Dixon Technologies is expanding into IT hardware, data centres and defence as it targets the global top five.
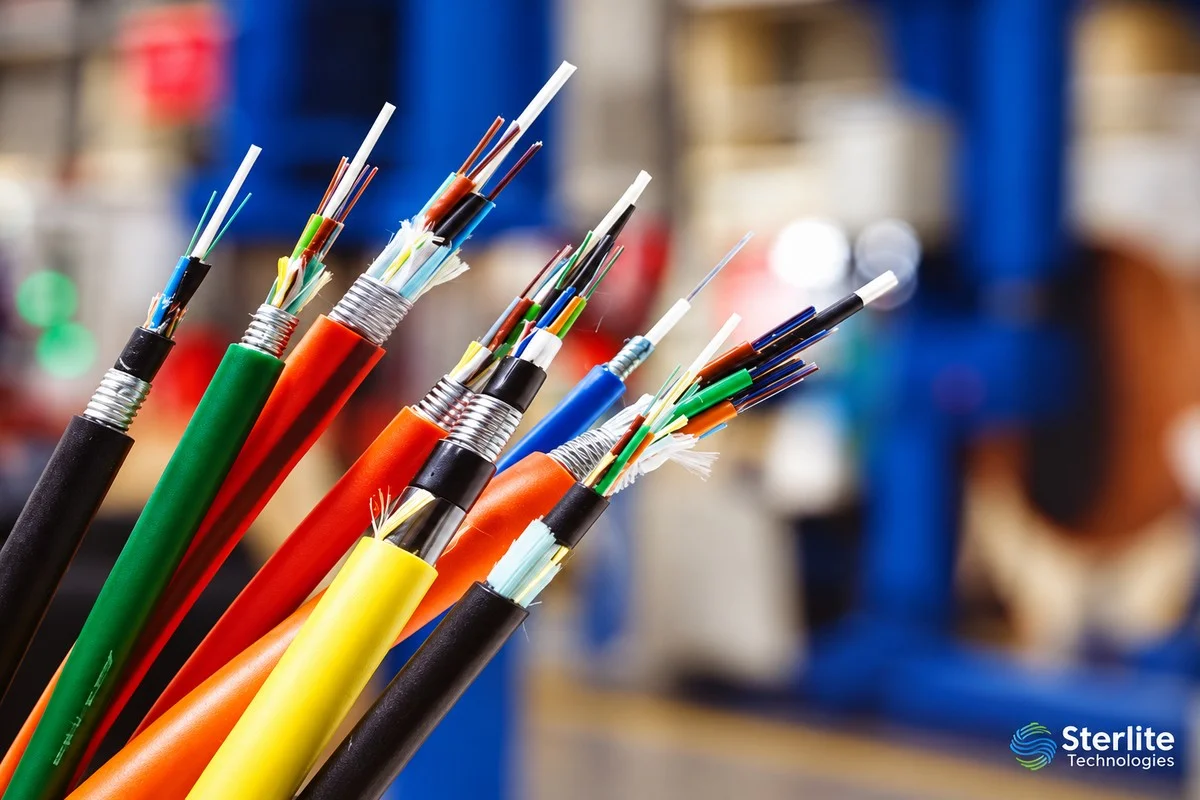
Sterlite Technologies has launched Neuralis fibre cables with up to 6,912 fibres, factory fitted connectors and options for large data centres.
Cubex Tubings shares gain 74% in four sessions after a Rs 135 crore fundraising plan. The EGM is scheduled for October 28, 2026.

Texmaco Rail shares gained 60% in FY27. Ventura Securities sees 32% upside to Rs 165 after a technical breakout, with Rs 102 stop loss.