Loading market data...
Tue, 29 Sept 2026
11:41:12 pm
Tue, 29 Sept 2026
11:41:12 pm

Rudransh Sangwan
Published at: August 10, 2026, 12:32 PM
Synopsis
Titan Company share price rises near its 52 week high as Q1 FY27 revenue grows 29% and net profit jumps 63%. Check financial results, valuation, cash flow, balance sheet, shareholding and key factors to watch.

Titan Company shares were trading at ₹5,098 on August 10, 2026, close to their 52 week high of ₹5,122, as investors continued to track the company's strong revenue and profit growth across its jewellery, watches and eyewear businesses. The stock has delivered a 47% return over the past year, while the company reported strong growth in its latest quarter, with consolidated sales rising 29% year on year to ₹21,356 crore and net profit increasing 63% to ₹1,777 crore.
The company remains one of India's leading lifestyle and consumer businesses, supported by its jewellery, watches and eyewear franchises and its association with the Tata Group. Its latest financial performance shows continued expansion in revenue and profitability, although the stock's valuation remains elevated at a P/E of 77.5 times. With the share price close to its yearly high, investors are now watching whether the company's earnings growth can continue to justify the premium valuation.
Loading chart...
Titan Company's market capitalisation stood at approximately ₹4.52 lakh crore, while the stock was trading at ₹5,098. The 52 week high stood at ₹5,122 and the 52 week low at ₹3,303, showing the substantial appreciation in the stock over the past year. The company reported a ROE of 37.7% and ROCE of 20.5%, highlighting strong returns generated on its capital base.
| Metric | Titan Company |
|---|---|
| Current Price | ₹5,098 |
| 52 Week High | ₹5,122 |
| 52 Week Low | ₹3,303 |
| Market Cap | ₹4,52,428 Cr |
| P/E | 77.5 |
| Book Value | ₹177 |
| Dividend Yield | 0.29% |
| ROCE | 20.5% |
| ROE | 37.7% |
| Face Value | ₹1 |
The stock is trading at around 28.8 times its book value, which indicates a premium valuation compared with its underlying book value. At the same time, the company has maintained a strong long term growth record, with sales growth of 23% over 10 years, 32% over five years and 29% over three years, while profit growth stood at 22%, 40% and 17% respectively over the same periods.
The latest quarterly numbers show a sharp improvement in both revenue and profitability. Consolidated sales increased to ₹21,356 crore in June 2026 from ₹16,523 crore in June 2025, representing growth of around 29%. Operating profit increased to ₹2,890 crore from ₹1,830 crore, while the operating profit margin improved to 14% from 11%.
Profit before tax increased to ₹2,429 crore from ₹1,480 crore, while consolidated net profit rose to ₹1,777 crore from ₹1,091 crore, representing growth of around 63%. EPS also increased from ₹12.29 to ₹20.02 during the quarter.
| Q1 Financials | Q1 FY27 | Q1 FY26 | YoY Change |
|---|---|---|---|
| Sales | ₹21,356 Cr | ₹16,523 Cr | +29% |
| Expenses | ₹18,466 Cr | ₹14,693 Cr | +26% |
| Operating Profit | ₹2,890 Cr | ₹1,830 Cr | +58% |
| OPM | 14% | 11% | +3 pp |
| Profit Before Tax | ₹2,429 Cr | ₹1,480 Cr | +64% |
| Net Profit | ₹1,777 Cr | ₹1,091 Cr | +63% |
| EPS | ₹20.02 | ₹12.29 | +63% |
The company's financial history shows a significant expansion in scale over the past decade. Consolidated sales increased from ₹11,913 crore in FY15 to ₹87,584 crore in FY26, while operating profit increased from ₹1,153 crore to ₹8,357 crore over the same period. Net profit also increased from ₹816 crore to ₹5,073 crore.
The latest trailing twelve month figures indicate that the growth momentum has continued, with sales reaching ₹92,417 crore, operating profit at ₹9,416 crore and net profit at ₹5,760 crore. TTM sales growth stood at 45%, while TTM profit growth was 57%.
| Financial Metric | FY15 | FY26 | TTM |
|---|---|---|---|
| Sales | ₹11,913 Cr | ₹87,584 Cr | ₹92,417 Cr |
| Operating Profit | ₹1,153 Cr | ₹8,357 Cr | ₹9,416 Cr |
| Operating Margin | 10% | 10% | 10% |
| Profit Before Tax | ₹1,049 Cr | ₹6,801 Cr | ₹7,751 Cr |
| Net Profit | ₹816 Cr | ₹5,073 Cr | ₹5,760 Cr |
| EPS | ₹9.19 | ₹57.14 | ₹64.89 |
The company recorded 45% TTM sales growth and 57% TTM profit growth, while its five year compounded sales growth stood at 32% and five year profit growth at 40%. Over the same period, the stock delivered a 23% CAGR, while the 10 year stock price CAGR stood at 29%.
Titan Company's balance sheet expanded alongside its business growth. Total assets increased from ₹5,868 crore in FY15 to ₹60,561 crore in FY26, while reserves increased to ₹15,614 crore from ₹2,995 crore during the same period. Fixed assets also expanded significantly to ₹6,878 crore in FY26 from ₹699 crore in FY15.
Borrowings stood at ₹30,621 crore in FY26, compared with ₹20,777 crore in FY25. The increase in borrowings is an important factor for investors to monitor as the company continues expanding its operations and investing across its businesses.
| Balance Sheet Metric | FY25 | FY26 |
|---|---|---|
| Reserves | ₹11,535 Cr | ₹15,614 Cr |
| Borrowings | ₹20,777 Cr | ₹30,621 Cr |
| Fixed Assets | ₹4,062 Cr | ₹6,878 Cr |
| Investments | ₹1,988 Cr | ₹3,506 Cr |
| Other Assets | ₹34,490 Cr | ₹50,014 Cr |
| Total Assets | ₹40,645 Cr | ₹60,561 Cr |
Cash generation improved significantly in FY26. Cash from operating activities increased to ₹5,590 crore from a negative ₹541 crore in FY25, while free cash flow rose to ₹4,713 crore from negative ₹1,011 crore. This represents a substantial improvement in the company's ability to generate cash from its operations.
At the same time, investing cash flow remained negative at ₹2,965 crore, reflecting continued investment in the business. Financing cash flow stood at negative ₹2,159 crore during FY26.
| Cash Flow Metric | FY25 | FY26 |
|---|---|---|
| Cash From Operating Activities | -₹541 Cr | ₹5,590 Cr |
| Cash From Investing Activities | ₹546 Cr | -₹2,965 Cr |
| Cash From Financing Activities | -₹7 Cr | -₹2,159 Cr |
| Net Cash Flow | -₹2 Cr | ₹466 Cr |
| Free Cash Flow | -₹1,011 Cr | ₹4,713 Cr |
| CFO/Operating Profit | 10% | 88% |
Titan Company has established leadership positions across jewellery, watches and eyewear, with brands and retail formats including Tanishq, Mia, Zoya, Titan, Fastrack and Titan EyePlus. The company's diversified lifestyle portfolio allows it to participate in India's expanding organised consumption market.
Its association with the Tata Group also remains an important part of its business profile. According to the provided data, the Tata Group held around 25% of the company, including a 21% holding through Tata Sons, while TIDCO held 28% as of FY26.
The latest June 2026 shareholding data shows promoter holding at 52.90%, broadly unchanged across the reported quarters. Foreign institutional investor holding stood at 15.39%, while domestic institutional investors increased their holding to 15.15%.
The movement in institutional ownership is an important indicator because DIIs have gradually increased their stake from 9.87% in September 2023 to 15.15% in June 2026, while FII ownership declined from 19.05% to 15.39% over the same period.
| Shareholder Category | Jun 2026 | Mar 2026 |
|---|---|---|
| Promoters | 52.90% | 52.90% |
| FIIs | 15.39% | 15.65% |
| DIIs | 15.15% | 14.84% |
| Government | 0.19% | 0.19% |
| Public | 16.31% | 16.34% |
| Others | 0.05% | 0.08% |
The strongest part of the investment case is the company's combination of high profitability, strong brand presence and long term earnings growth. ROE stood at 37.7%, while five year profit growth was 40% and TTM profit growth was 57%, indicating that the business has continued to expand earnings at a strong pace.
The major factor investors need to consider is valuation. At a P/E of 77.5 times and around 28.8 times book value, the stock is priced at a substantial premium. Sustaining high revenue growth, improving operating margins, maintaining strong cash generation and delivering continued earnings growth will therefore remain important for the stock to sustain its current valuation.
Titan Company remains one of India's leading consumer and lifestyle businesses, with its latest results showing strong revenue growth, improving operating margins and a sharp increase in profit. Sales reached ₹92,417 crore on a TTM basis, while net profit stood at ₹5,760 crore.
With the stock trading close to its ₹5,122 52 week high, the market is already pricing in significant growth expectations. The key question for investors is whether the company's strong earnings trajectory can continue at a pace that supports its premium valuation. The stock's future performance will therefore depend on continued growth across its core businesses, operating leverage, cash generation and the company's ability to maintain its competitive position in India's organised consumer market.
Titan Company's share price was ₹5,098 as of August 10, 2026, with the stock trading close to its 52 week high of ₹5,122.
Titan Company's 52 week high is ₹5,122, while its 52 week low is ₹3,303.
Titan Company had a market capitalisation of approximately ₹4.52 lakh crore based on the provided data.
Titan Company reported 29% year on year growth in consolidated sales to ₹21,356 crore, while net profit increased 63% to ₹1,777 crore in Q1 FY27.
The company's consolidated net profit stood at ₹1,777 crore in Q1 FY27, compared with ₹1,091 crore in Q1 FY26.
Titan Company's consolidated sales increased to ₹21,356 crore in Q1 FY27, compared with ₹16,523 crore in the corresponding quarter of the previous year.
Titan Company's P/E ratio was approximately 77.5 times based on the provided stock data.
Titan Company's return on equity stood at approximately 37.7%, while its ROCE was 20.5%.
Yes. At ₹5,098, the stock was trading very close to its 52 week high of ₹5,122, indicating strong recent price performance.
Titan Company's stock delivered approximately a 47% return over the past one year based on the provided data.
Titan Company operates across major lifestyle and consumer categories including jewellery, watches and eyewear, with established brands and retail formats across these segments.
Yes. Titan Company is associated with the Tata Group, which held approximately 25% of the company according to the FY26 ownership information provided.
The key consideration is the company's premium valuation, with the stock trading at around 77.5 times earnings and 28.8 times book value. Investors also need to monitor whether strong revenue and profit growth can continue at the current pace.
Investors should monitor earnings growth, jewellery demand, operating margins, cash generation, consumer spending, business expansion and valuation as the stock trades close to its 52 week high.
Financial journalist specializing in market analysis, stock research, and investment trends. Dedicated to providing accurate, timely insights for informed decision-making.
Credentials: Experienced financial journalist with expertise in equity markets and economic analysis
The information provided in this article is for educational and informational purposes only and should not be construed as financial, investment, or legal advice. welomoney does not provide personalized investment recommendations.
For detailed terms and conditions, please read our Disclaimer and Terms of Service.
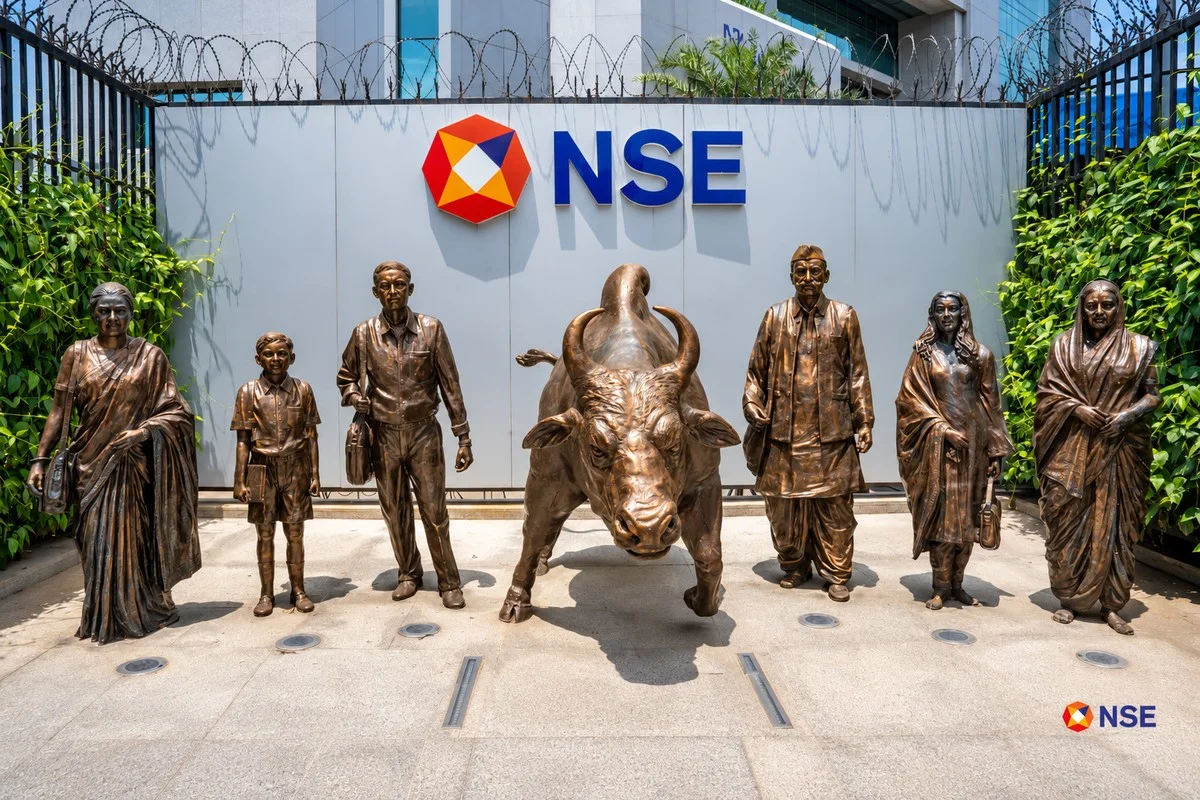
NSE shares fell after listing at Rs 1,800, dropping to 12th by market value. Experts identify Rs 1,760 support and Rs 1,795 resistance.
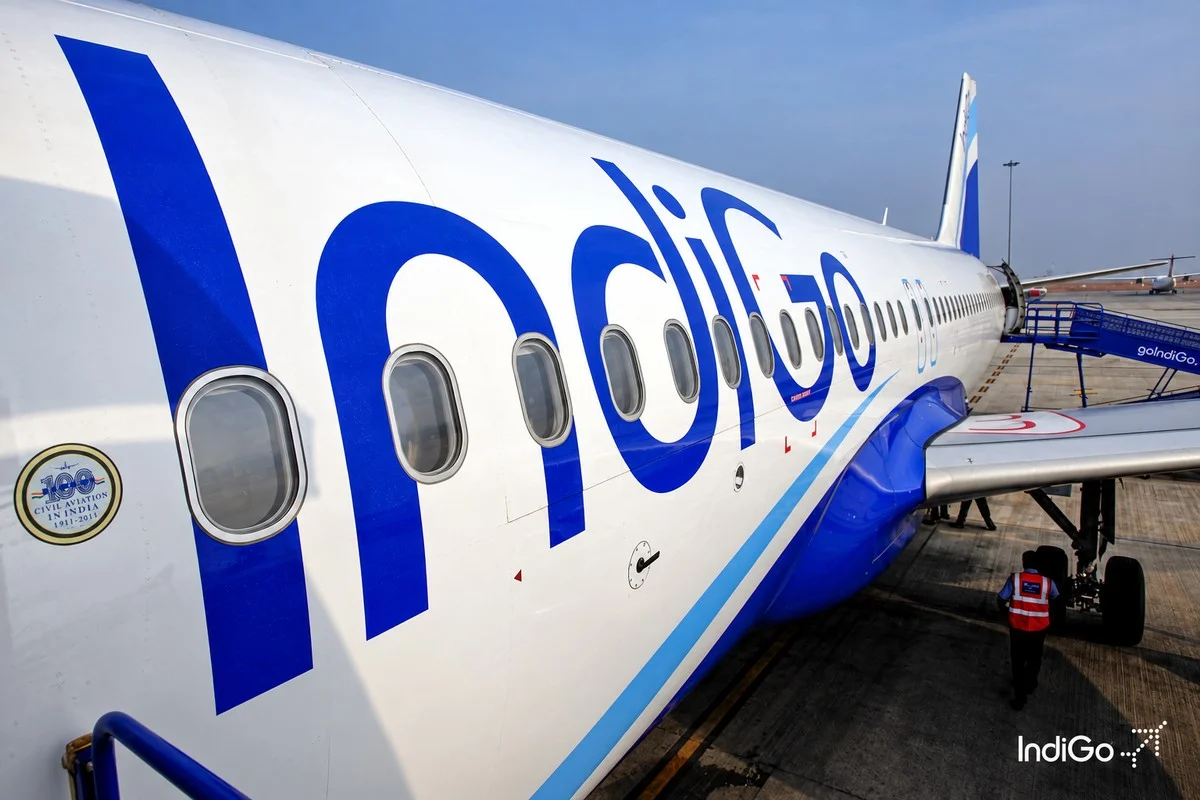
Goldman Sachs retains its Buy rating on IndiGo with a Rs 5,900 target, citing international growth, cost leadership and better FY28 profitability.
Kirloskar Oil Engines posted 16% Q1 FY27 revenue growth, while margins missed estimates. Motilal Oswal cut earnings estimates and raised its target...
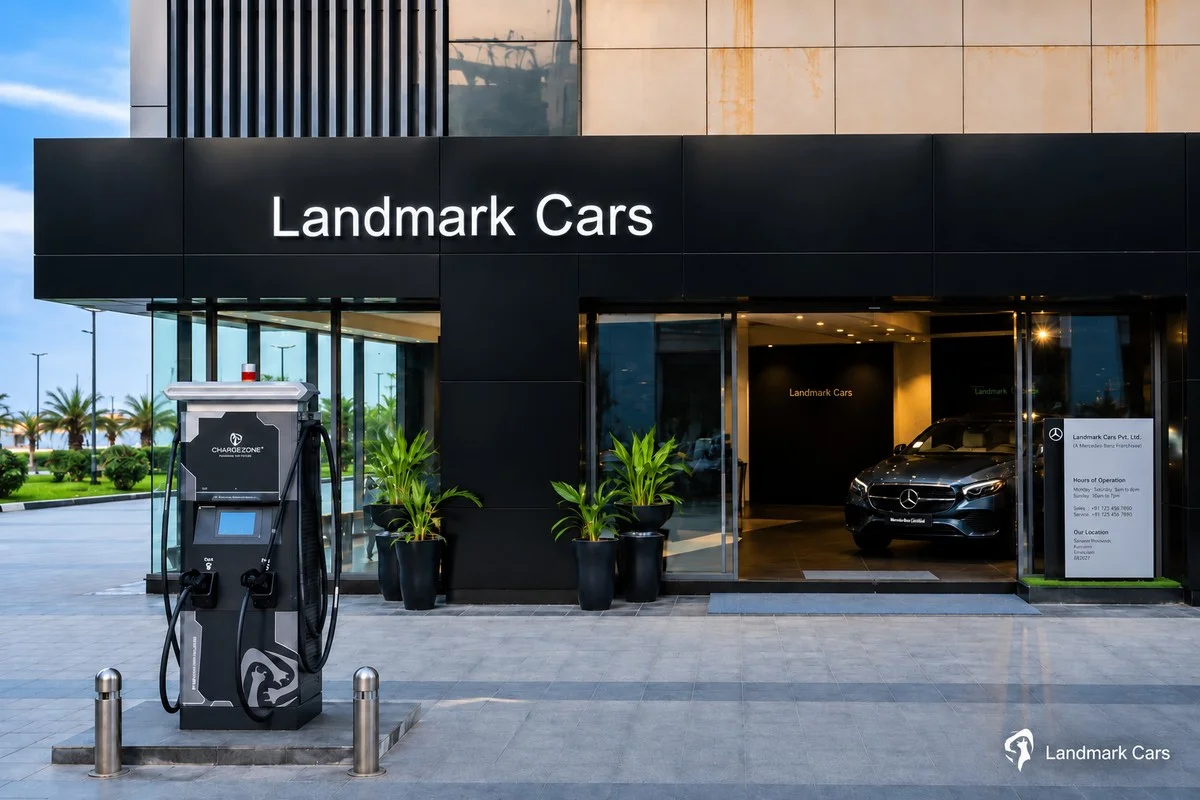
Landmark Cars shares rose 12% to Rs 535.80 after adding BYD and M&M outlets, taking its network to 143 locations, with EV sales at 30% of Q1FY27 new...

Tata Motors’ subsidiary acquired 26,000 shares in Mateshwari E-Smart Mobility for ₹2.6 lakh.