Loading market data...
Sun, 15 Nov 2026
12:06:25 am
Sun, 15 Nov 2026
12:06:25 am

Rudransh Sangwan
Published at: October 16, 2026, 5:33 AM
Synopsis
Tech Mahindra shares jump 7.2% to ₹1,768.90 after Q2 FY27 results. Check revenue, profit, trading volume, share price returns and key metrics.
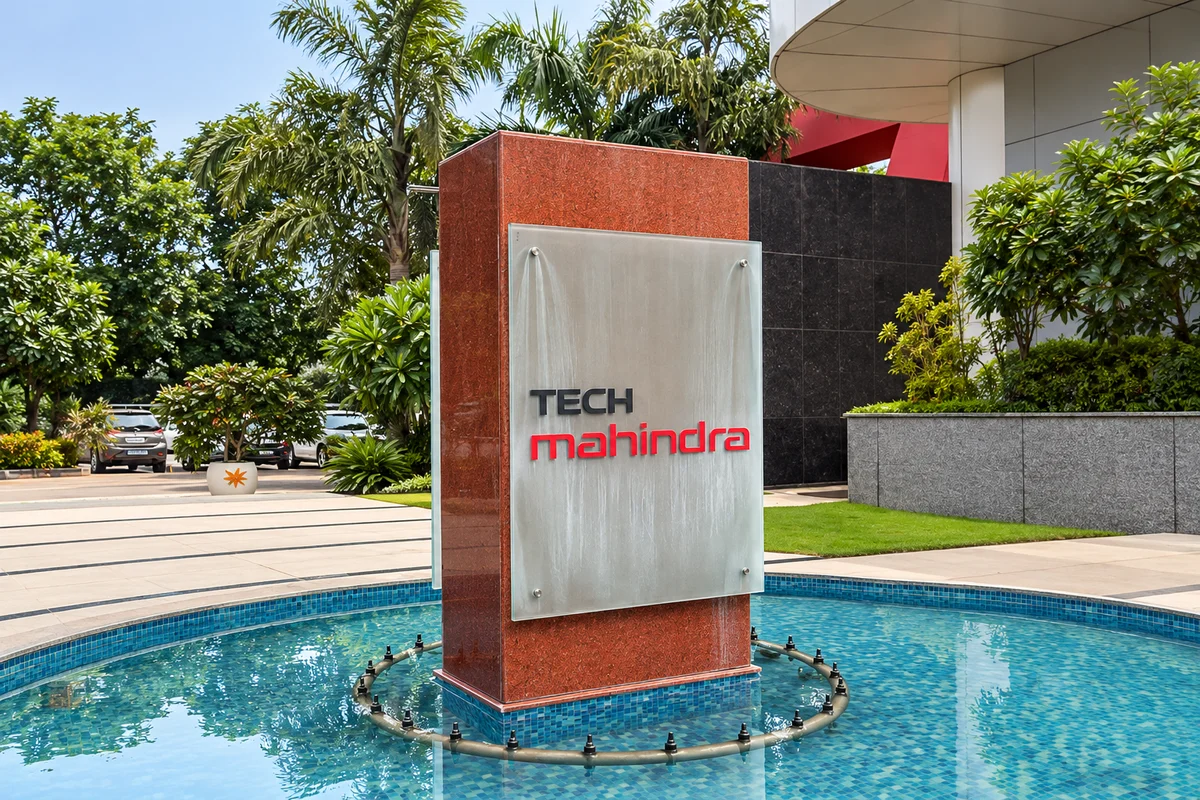
Tech Mahindra shares rose 7.20% to ₹1,768.90 on the NSE on October 16, 2026, following the company's second quarter FY27 results. The stock gained ₹118.91 during the session and touched an intraday high of ₹1,776.50.
Trading volume stood at 1.17 crore shares as of 10:59 AM IST. The stock's latest price was approaching its 52 week high of ₹1,854.
| Metric | Details |
|---|---|
| Share price | ₹1,768.90 |
| Daily price change | +7.20% |
| Previous close | ₹1,649.99 |
| Opening price | ₹1,712 |
| Intraday high | ₹1,776.50 |
| Intraday low | ₹1,690.10 |
| Trading volume | 1.17 crore shares |
| Market capitalisation | ₹1,72,960.63 crore |
| P/E ratio | 31.30 |
| EPS, trailing 12 months | ₹56.39 |
| 52 week high | ₹1,854 |
| 52 week low | ₹1,304.10 |
Tech Mahindra reported a 32.7% year on year increase in net profit to ₹1,585.6 crore for the second quarter of FY27. Revenue rose 15.6% to ₹16,180.2 crore, while EBITDA increased 32.8% to ₹2,878.5 crore.
The results showed growth in revenue and profit, putting operating margins, deal execution and demand across the company's business segments in focus.
The stock has recorded positive returns across the periods listed in the supplied data.
| Period | Share price return |
|---|---|
| 1 day | +6.87% |
| 1 week | +16.46% |
| 1 month | +13.18% |
| 3 months | +16.75% |
| 1 year | +20.46% |
| 3 years | +48.85% |
| 5 years | +23.24% |
The one week return of 16.46% reflects the stock's recent momentum. However, past performance does not guarantee future returns.
The company's board meeting on October 15 included quarterly results, an interim dividend and a bonus issue on the agenda, according to the supplied stock data. Any dividend or bonus related development should be confirmed through the company's official announcements.
The latest share price movement follows the release of quarterly results, but the available figures do not establish that results alone explain the entire rally. Future performance will depend on business growth, deal execution and broader IT sector conditions.
Financial journalist specializing in market analysis, stock research, and investment trends. Dedicated to providing accurate, timely insights for informed decision-making.
Credentials: Experienced financial journalist with expertise in equity markets and economic analysis
The information provided in this article is for educational and informational purposes only and should not be construed as financial, investment, or legal advice. welomoney does not provide personalized investment recommendations.
For detailed terms and conditions, please read our Disclaimer and Terms of Service.

Kellton Tech Q2FY27 results: Revenue grows 6.5% to ₹3,206 million. Check net profit, EBITDA margins, H1 performance and the new GCC joint venture.
Swaraj Suiting Q2FY27 results: Net profit rises 94% to ₹1,728.82 lakh as revenue jumps 72%. Check H1FY27 earnings, cash flow, borrowings and...

Super Tannery Q2FY27 results: Standalone net profit rises 128% to ₹257.58 lakh, while revenue grows 28.17%. Check consolidated results and cash flow.

Parvati Sweetners Q2FY27 results show revenue of ₹1,373.34 lakh and a narrower net loss of ₹203.05 lakh.

Jindal Poly Films Q2FY27 results: Standalone net loss widens to ₹349.98 crore after a ₹292 crore subsidiary loan provision.