Loading market data...
Sun, 22 Nov 2026
02:51:27 pm
Sun, 22 Nov 2026
02:51:27 pm

Rudransh Sangwan
Published at: November 18, 2026, 6:57 AM
Tata Steel shares traded at ₹179.10, down 1.32%, with a market capitalisation of ₹2.24 lakh crore.
The company is advancing a hydrogen project in Odisha and discussing financial assistance with the Dutch government for its European operations.
| Development | Key Details |
|---|---|
| Hydrogen production plan | 10 tonnes/day |
| Project location | Kalinganagar, Odisha |
| Technology partner | Utility Global |
| Technology | H2Gen |
| Target steel capacity in India | 40 MTPA |
| Net Zero target | 2045 |
| Dutch government aid | Discussions ongoing |
The proposed project will use industrial gases from blast furnaces to produce hydrogen. A Front-End Engineering and Design (FEED) study is planned.
Dutch assistance: Tata Steel has sought financial support for its European operations. No final agreement or assistance amount has been announced.
| Metric | Value |
|---|---|
| Current Price | ₹179.10 |
| Daily Change | -1.32% |
| Market Cap | ₹2.24 lakh crore |
| 52-Week High | ₹224.40 |
| 52-Week Low | ₹160.06 |
| Period | Return |
|---|---|
| 1 Day | -1.16% |
| 5 Days | -2.95% |
| 1 Month | +2.22% |
| 6 Months | -17.27% |
| 1 Year | +3.60% |
| 5 Years | +47.04% |
September 2026 vs September 2025
| Financial Metric | Sep 2025 | Sep 2026 | Growth |
|---|---|---|---|
| Revenue | ₹58,630 Cr | ₹65,789 Cr | +12.2% |
| EBITDA | ₹8,417 Cr | ₹10,780 Cr | +28.1% |
| Net Profit | ₹3,183 Cr | ₹3,700 Cr | +16.2% |
| EPS | ₹2.49 | ₹2.94 | — |
| Operating Margin | 14% | 15% | +1 pp |
Tata Steel reported year-on-year growth in Q2 FY27, while its hydrogen initiative supports its decarbonisation plans. Dutch assistance discussions and rising raw material costs remain key developments to watch.
Loading chart...
All financial figures are in ₹ crore unless otherwise specified. Market data is based on the supplied snapshot.
| Metric | Value |
|---|---|
| Share Price | ₹179.10 |
| Daily Change | -₹2.40 (-1.32%) |
| Market Capitalisation | ₹2,23,954.48 crore |
| P/E Ratio | 19.20 |
| P/B Ratio | 2.22 |
| EPS | ₹8.65 |
| Book Value | ₹81.91 |
| EBITDA (Key Fundamentals) | ₹35,754.20 crore |
| Dividend Yield | 2.20% |
| Return on Equity | 10.49 |
| Debt-to-Equity | 0.98 |
| Sector | Metals & Mining |
| Industry | Ferrous Metals |
| Metric | Value |
|---|---|
| Open | ₹180.75 |
| Previous Close | ₹181.50 |
| Day High | ₹181.00 |
| Day Low | ₹178.40 |
| Average Price | ₹179.41 |
| Volume (displayed panels) | 65,09,397–71,16,901 shares |
| Upper Circuit | ₹199.65 |
| Lower Circuit | ₹163.35 |
| 52-Week High | ₹224.40 |
| 52-Week Low | ₹160.06 |
| 3-Year High / Low | ₹224.40 / ₹122.62 |
| 5-Year High / Low | ₹224.40 / ₹82.70 |
| Period | Return |
|---|---|
| 1 Day | -1.16% |
| 5 Days | -2.95% |
| 1 Month | +2.22% |
| 6 Months | -17.27% |
| 1 Year | +3.60% |
| 5 Years | +47.04% |
September 2025 vs September 2026
| Particulars | Sep 2025 | Sep 2026 |
|---|---|---|
| Revenue | 58,630 | 65,789 |
| Expenses | 50,213 | 55,009 |
| EBITDA | 8,417 | 10,780 |
| Operating Profit Margin | 14% | 15% |
| Depreciation | 2,893 | 3,782 |
| Interest | 1,775 | 2,005 |
| Profit Before Tax | 4,223 | 5,455 |
| Tax | 1,039 | 1,756 |
| Net Profit | 3,183 | 3,700 |
| EPS (₹) | 2.49 | 2.94 |
Year-on-year movement:
| Particulars | Mar 2025 | Mar 2026 |
|---|---|---|
| Total Assets | 2,79,395 | 3,01,254 |
| Fixed Assets | 1,50,914 | 1,79,908 |
| Capital Work in Progress | 41,622 | 28,497 |
| Investments | 6,194 | 7,089 |
| Other Assets | 80,664 | 85,760 |
| Current Liabilities | 86,094 | 96,918 |
| Non-Current Liabilities | 1,01,949 | 1,00,556 |
| Total Equity | 91,353 | 1,03,781 |
| Reserves and Surplus | 89,922 | 1,00,920 |
| Share Capital | 1,247 | 1,247 |
| Particulars | Mar 2025 | Mar 2026 |
|---|---|---|
| Operating Activities | 23,138 | 35,065 |
| Investing Activities | -13,611 | -14,397 |
| Financing Activities | -7,002 | -21,387 |
| Net Cash Flow | 2,524 | -720 |
Operating cash flow increased in FY26, while higher financing outflows contributed to negative net cash flow for the year.
| Year | Dividend Per Share (₹) | Dividend Yield |
|---|---|---|
| 2017 | 10.00 | 17.51% |
| 2018 | 10.00 | 19.19% |
| 2019 | 13.00 | 48.22% |
| 2020 | 10.00 | 12.32% |
| 2021 | 25.00 | 19.12% |
| 2022 | 51.00 | 48.80% |
| 2023 | 3.60 | 2.31% |
| 2024 | 3.60 | 2.33% |
| 2025 | 3.60 | 1.88% |
| 2026 | 4.00 | 2.20% |
The supplied corporate-action history includes a ₹4 per-share dividend with a record date of 12 June 2026. The company also recorded a 1:10 stock split in July 2022. Historical dividend comparisons should account for the split.
Based on 34 analysts.
| Recommendation | Percentage |
|---|---|
| Buy | 64.71% |
| Hold | 17.65% |
| Sell | 17.65% |
Buy recommendations represent the largest share of the analyst ratings, although a portion of analysts maintain Hold or Sell views.
| Indicator | Value | Signal |
|---|---|---|
| RSI (14) | 51.39 | Neutral |
| ATR (14) | 4.87 | Less Volatile |
| Stochastic (9,6) | 58.32 | Neutral |
| Stochastic RSI (14) | 59.26 | Neutral |
| MACD (12,26) | 0.79 | Bullish |
| ADX (14) | 21.68 | Weak Trend |
| Ultimate Oscillator | 46.18 | Bearish |
| ROC | 8.29 | Uptrend and Accelerating |
| Williams %R | -46.66 | Neutral |
Technical signal count: 3 Bearish, 4 Neutral and 2 Bullish.
| Company | Market Cap (₹ Cr) | P/E | Revenue (₹ Cr) | Revenue Growth | Net Profit (₹ Cr) | Profit Growth |
|---|---|---|---|---|---|---|
| Tata Steel | 2,23,954.48 | 19.20 | 2,33,541.70 | 6.12% | 10,886 | 16.23% |
| JSW Steel | 3,21,210.38 | 10.30 | 1,86,718.00 | 10.15% | 25,508 | 225.58% |
| Hindustan Zinc | 2,26,561.60 | 11.20 | 41,934.00 | 19.59% | 13,832 | 142.05% |
| Hindalco Industries | 2,03,531.31 | 10.90 | 2,77,833.00 | 15.19% | 13,391 | 58.89% |
| VAML | 1,50,276.21 | 7.10 | 0.00 | 0.00% | 0 | — |
| Jindal Steel | 1,13,097.17 | 40.70 | 53,783.10 | 6.93% | 3,361 | 21.34% |
| Steel Authority of India | 67,492.78 | 12.60 | 1,11,705.00 | 8.08% | 3,373 | 318.08% |
| Jindal Stainless | 60,500.03 | 18.10 | 43,384.60 | 9.12% | 3,185 | 11.13% |
| NALCO | 57,054.97 | 8.20 | 18,508.90 | 7.96% | 5,797 | 28.34% |
| Hindustan Copper | 40,755.23 | 28.40 | 3,149.70 | 46.62% | 921 | 181.88% |
Peer figures are reproduced from the supplied comparison and may use different reporting periods or measurement bases.
| Indicator | Reported Value |
|---|---|
| Revenue Growth | 6.12% |
| Net Income Growth | 242.99% |
| Cash Flow Change | 51.55% |
| ROE Growth Indicator | 202.31% |
| ROCE Growth Indicator | 38.90% |
| Average EBITDA Margin Change | 25.59% |
| Development | Details |
|---|---|
| Hydrogen project | FEED planned with Utility Global at Kalinganagar, Odisha |
| Proposed hydrogen output | 10 tonnes per day |
| Technology | H2Gen, using blast furnace and basic oxygen furnace gases |
| Indian capacity ambition | 40 MTPA |
| Net Zero target | 2045 |
| Dutch government assistance | Financial support discussions ongoing |
| Coking coal sourcing | Primarily Australia, with limited Indonesian imports |
| Domestic industry concerns | Rising iron ore costs and Chinese steel imports |
Financial journalist specializing in market analysis, stock research, and investment trends. Dedicated to providing accurate, timely insights for informed decision-making.
Credentials: Experienced financial journalist with expertise in equity markets and economic analysis
The information provided in this article is for educational and informational purposes only and should not be construed as financial, investment, or legal advice. welomoney does not provide personalized investment recommendations.
For detailed terms and conditions, please read our Disclaimer and Terms of Service.
No related topics available
Welspun Living approves ₹3,200 crore capex in subsidiary WHSL, adding Terry Towel, weaving and yarn capacity, with completion targeted for December...
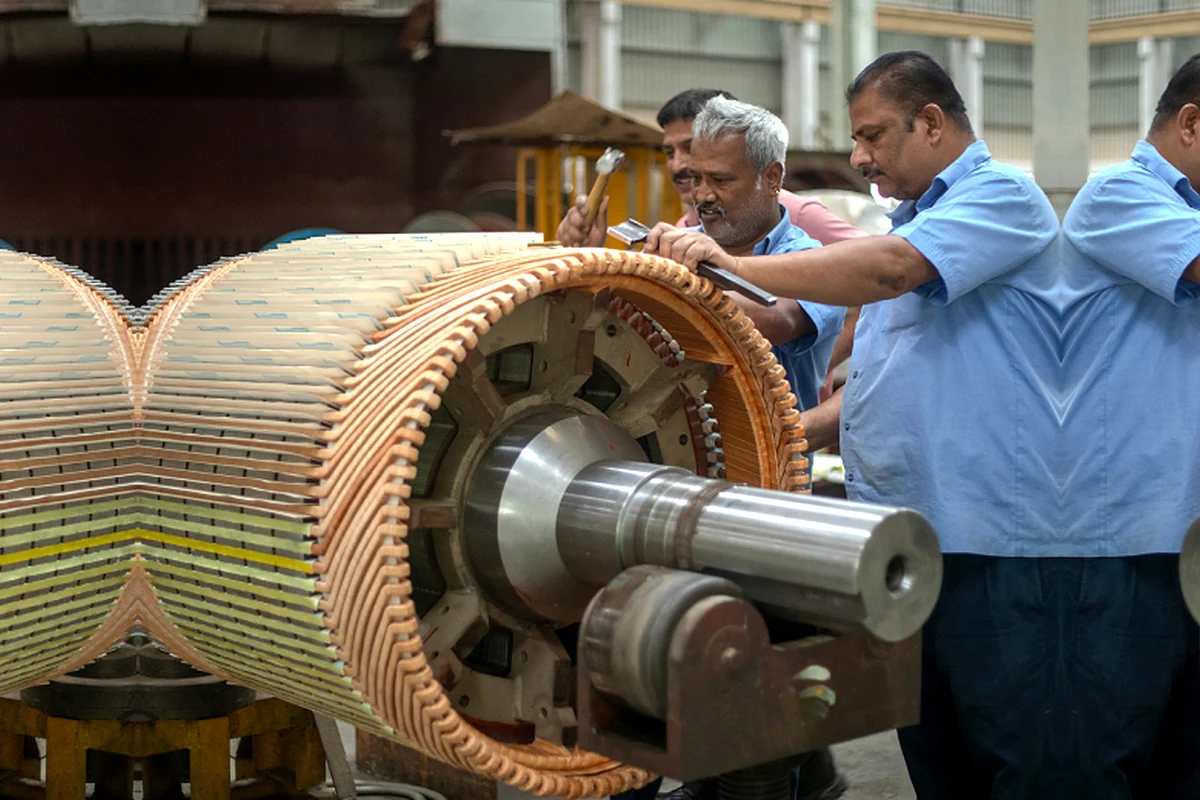
Kirloskar Electric shares trade at ₹104.70 after a 1.8% decline. Check Q2 FY27 results, ₹100 crore working capital facility, financials and technical...
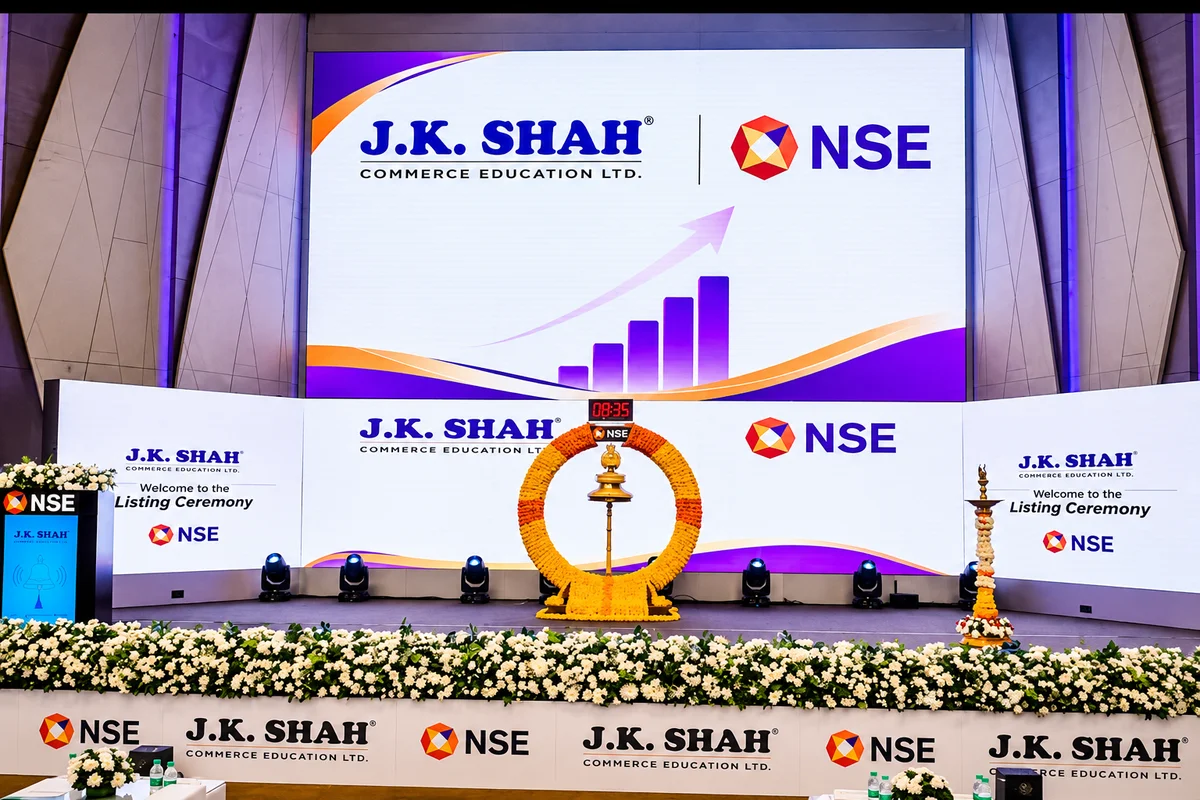
JK Shah Commerce Education shares fell 5% to ₹187.72 and hit the reported lower circuit. Check share price, Q1 FY27 financial data, filings and...

Samyak International reports Q2 FY27 revenue of ₹29 crore and net profit of ₹1 crore. Check its Panda Tech resolution, financial results and stock...
BLS Polymers shares fell 4.33% to ₹270.32 after an 81% rally. Explore FY26 revenue, net profit, EBITDA, Q1 results update, market data and technical...