Loading market data...
Sun, 22 Nov 2026
01:39:04 pm
Sun, 22 Nov 2026
01:39:04 pm

Rudransh Sangwan
Published at: November 20, 2026, 10:09 AM
Synopsis
BLS Polymers shares fell 4.33% to ₹270.32 after an 81% rally. Explore FY26 revenue, net profit, EBITDA, Q1 results update, market data and technical indicators.
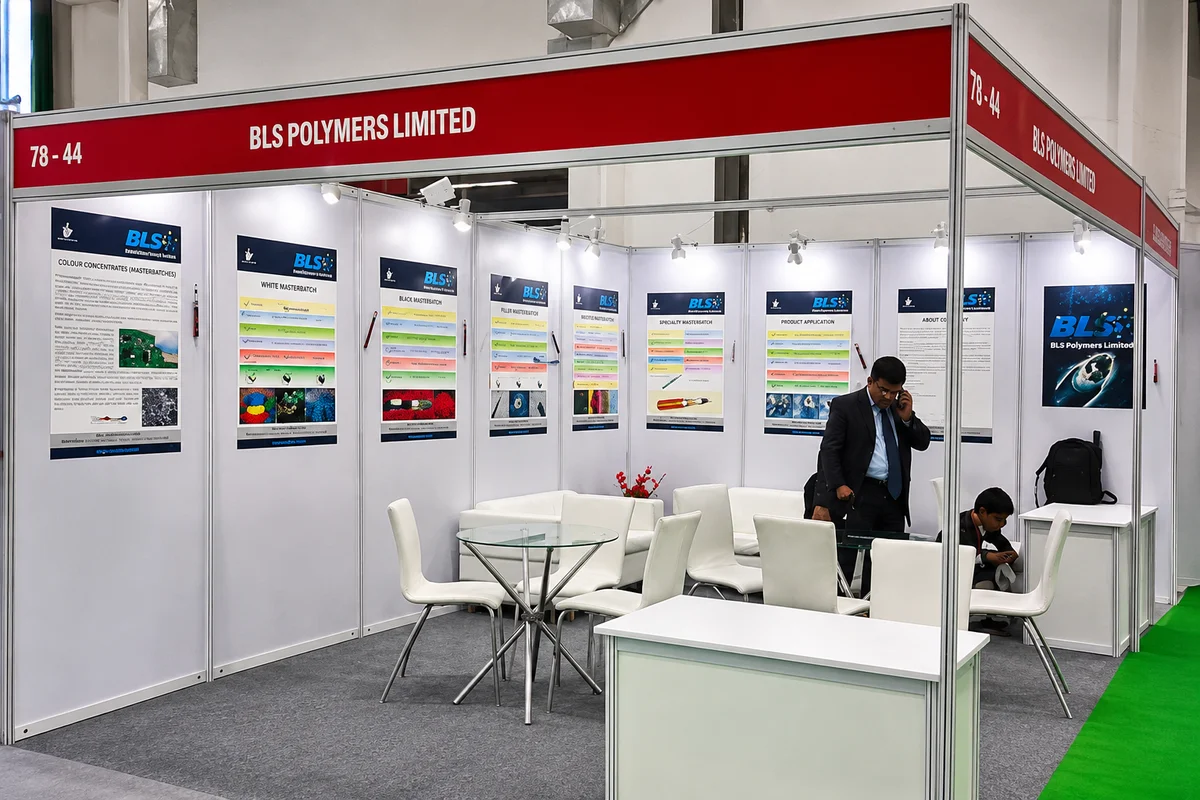
BLS Polymers shares fell 4.33% to ₹270.32 in the latest trading session, even as the stock continued to show strong gains over recent months.
The share price has risen 81.27% over the one-month, six-month and one-year periods, according to the supplied performance data. The latest decline follows this sharp rally.
| Particular | Value |
|---|---|
| Last Traded Price | ₹270.32 |
| Daily Change | -₹12.24 (-4.33%) |
| Market Capitalisation | ₹1,686.65 crore |
| P/E Ratio | 65.10 |
| P/B Ratio | 5.02 |
| EPS | ₹5.99 |
| Book Value | ₹56.41 |
| Dividend Yield | 0% |
| 52-Week High | ₹303.70 |
| 52-Week Low | ₹150.00 |
The stock touched an intraday high of ₹287.60 and a low of ₹265.30. Its previous closing price was ₹282.56.
BLS Polymers announced its quarterly results for the quarter and half year ended September 30, 2026. The company also released an investor presentation and other related exchange disclosures.
The supplied financial data provides annual standalone figures rather than the detailed September 2026 quarterly numbers.
Its annual performance shows improvement in key financial measures:
| Financial Metric | FY25 | FY26 |
|---|---|---|
| Revenue | ₹337 crore | ₹354 crore |
| EBITDA | ₹40 crore | ₹47 crore |
| Net Profit | ₹21 crore | ₹27 crore |
| EPS | ₹4.69 | ₹5.99 |
The company's trailing 12-month figures show revenue of ₹409 crore, EBITDA of ₹57 crore and net profit of ₹35 crore.
The supplied data does not include an analyst recommendation or target price for BLS Polymers.
Technical indicators show a mixed reading, with five bullish, two bearish and two neutral signals. The reported ROC stands at 5.12, indicating an accelerating uptrend in the supplied technical assessment.
The stock's recent movement is worth watching alongside its financial performance:
| Period | Share Price Return |
|---|---|
| 1 Day | -3.77% |
| 5 Days | +15.83% |
| 1 Month | +81.27% |
| 6 Months | +81.27% |
| 1 Year | +81.27% |
The daily performance panel reports a -3.77% move, while the main quote shows a 4.33% decline. These figures differ in the supplied market data.
Investors will be watching the detailed September-quarter results, trading activity and the company's ability to sustain its financial growth following the stock's sharp rally.
| Particular | Value |
|---|---|
| Last Traded Price | ₹270.32 |
| Daily Change | -₹12.24 (-4.33%) |
| Market Capitalisation | ₹1,686.65 crore |
| P/E Ratio | 65.10 |
| P/B Ratio | 5.02 |
| EPS | ₹5.99 |
| Book Value | ₹56.41 |
| EBITDA | ₹46.90 crore |
| Dividend Yield | 0% |
| Return on Equity | 28.45% |
| Debt-to-Equity | 0.79 |
| Sector | Chemicals |
| Industry | Chemicals & Petrochemicals |
| Period | Return |
|---|---|
| 1 Day | -3.77% |
| 5 Days | +15.83% |
| 1 Month | +81.27% |
| 6 Months | +81.27% |
| 1 Year | +81.27% |
| 5 Years | +81.27% |
| Particular | Price |
|---|---|
| Open | ₹282.56 |
| Day High | ₹287.60 |
| Day Low | ₹265.30 |
| Previous Close | ₹282.56 |
| Average Price | ₹273.39 |
| Volume (Overview) | 1,09,45,532 |
| Volume (Market Today) | 1,36,80,584 |
| Upper Circuit | ₹339.07 |
| Lower Circuit | ₹226.05 |
| 52-Week High | ₹303.70 |
| 52-Week Low | ₹150.00 |
| 3-Year High | ₹303.70 |
| 3-Year Low | ₹150.00 |
| 5-Year High | ₹303.70 |
| 5-Year Low | ₹150.00 |
Standalone figures in ₹ crore, except EPS.
| Metric | FY24 | FY25 | FY26 | TTM |
|---|---|---|---|---|
| Revenue | 302 | 337 | 354 | 409 |
| Expenses | 280 | 297 | 308 | 351 |
| EBITDA | 22 | 40 | 47 | 57 |
| Operating Profit Margin | 6% | 10% | 12% | 13% |
| Depreciation | 3 | 3 | 3 | 3 |
| Interest | 9 | 9 | 8 | 8 |
| Profit Before Tax | 10 | 28 | 36 | 46 |
| Tax | 2 | 7 | 9 | 12 |
| Net Profit | 8 | 21 | 27 | 35 |
| EPS (₹) | 1.67 | 4.69 | 5.99 | 7.70 |
Important financial observations:
Standalone figures in ₹ crore.
| Particular | March 2025 | March 2026 |
|---|---|---|
| Total Assets | 179 | 206 |
| Fixed Assets | 20 | 23 |
| Capital Work in Progress | 0 | 2 |
| Investments | 0 | 0 |
| Other Assets | 159 | 182 |
| Current Liabilities | 109 | 107 |
| Non-Current Liabilities | 2 | 4 |
| Total Equity | 68 | 95 |
| Reserves and Surplus | 58 | 50 |
| Share Capital | 10 | 45 |
Balance-sheet highlights:
| Company | Market Cap (₹ Cr) | P/E | Revenue (₹ Cr) | Revenue Growth | Net Profit (₹ Cr) | Profit Growth |
|---|---|---|---|---|---|---|
| Solar Industries | 1,69,542.17 | 72.90 | 9,965.70 | 30.94% | 1,737 | 79.81% |
| Pidilite Industries | 1,63,817.56 | 59.10 | 14,867.00 | 11.05% | 2,471 | 7.17% |
| SRF | 74,562.70 | 32.60 | 15,893.60 | 7.20% | 1,835 | 31.14% |
| Linde India | 56,722.54 | 116.50 | 2,548.90 | -0.17% | 549 | -30.53% |
| Gujarat Fluorochemicals | 54,540.53 | 82.80 | 5,126.30 | 5.63% | 574 | 34.08% |
| Navin Fluorine | 51,954.05 | 57.50 | 3,379.20 | 41.21% | 664 | 81.40% |
| Himadri Speciality Chemical | 28,326.79 | 32.50 | 4,832.00 | 3.60% | 755 | 31.35% |
| Aether Industries | 21,562.97 | 90.30 | 1,181.10 | 34.17% | 220 | 25.93% |
| Deepak Nitrite | 20,999.07 | 20.00 | 7,946.90 | -5.01% | 551 | 234.76% |
| Deepak Fertilisers | 18,370.13 | 15.70 | 11,609.00 | 12.11% | 739 | 84.02% |
Peer figures are reproduced from the supplied comparison data. The table does not establish that all companies have identical reporting periods or business models.
Financial journalist specializing in market analysis, stock research, and investment trends. Dedicated to providing accurate, timely insights for informed decision-making.
Credentials: Experienced financial journalist with expertise in equity markets and economic analysis
The information provided in this article is for educational and informational purposes only and should not be construed as financial, investment, or legal advice. welomoney does not provide personalized investment recommendations.
For detailed terms and conditions, please read our Disclaimer and Terms of Service.
Welspun Living approves ₹3,200 crore capex in subsidiary WHSL, adding Terry Towel, weaving and yarn capacity, with completion targeted for December...
Kirloskar Electric shares trade at ₹104.70 after a 1.8% decline. Check Q2 FY27 results, ₹100 crore working capital facility, financials and technical...
JK Shah Commerce Education shares fell 5% to ₹187.72 and hit the reported lower circuit. Check share price, Q1 FY27 financial data, filings and...

Samyak International reports Q2 FY27 revenue of ₹29 crore and net profit of ₹1 crore. Check its Panda Tech resolution, financial results and stock...
Angel One shares gained 3.58% to ₹348.50. Check Q2 FY27 results, MTF revenue contribution, analyst ratings, technical indicators and share price...