Loading market data...
Sun, 22 Nov 2026
02:51:30 pm
Sun, 22 Nov 2026
02:51:30 pm

Rudransh Sangwan
Published at: November 18, 2026, 6:21 AM
Synopsis
Reliance Industries shares trade at ₹1,359.40, gaining 12.12% in one month. Check Q2 FY27 revenue, net profit, EBITDA, analyst ratings and technical indicators.
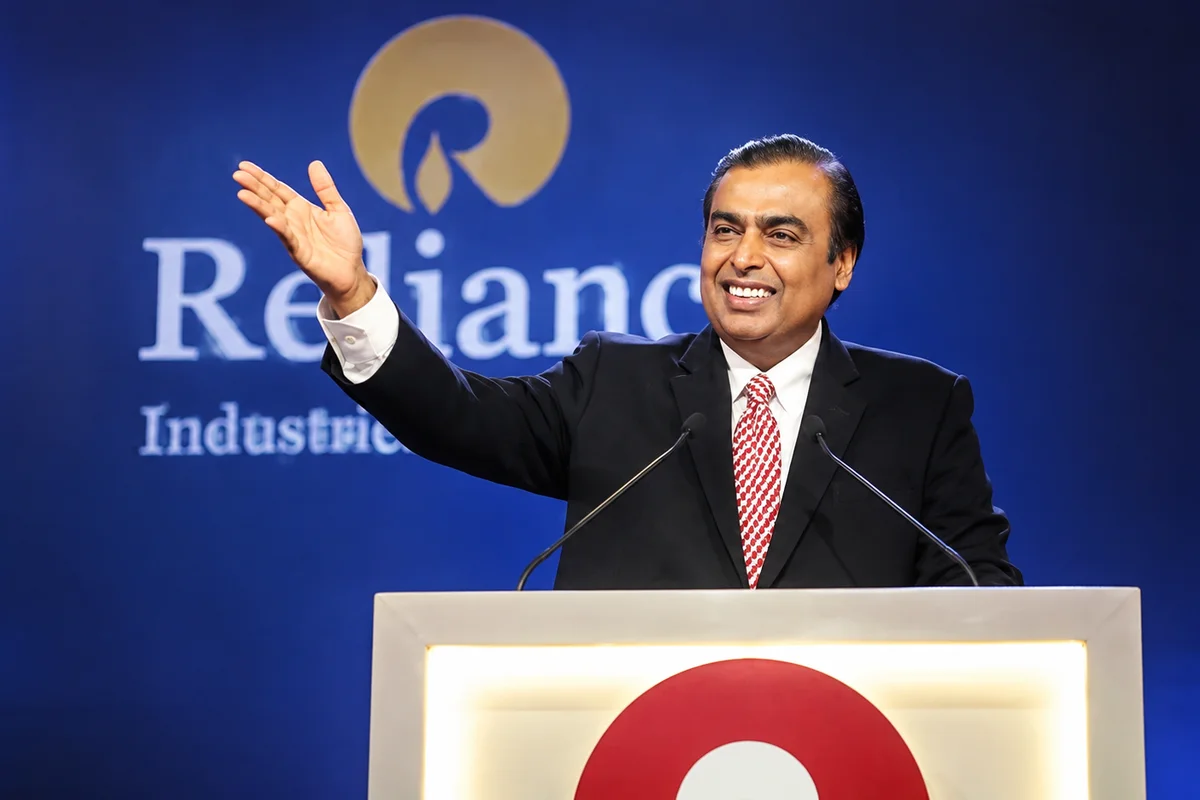
Reliance Industries Limited shares were trading at ₹1,359.40, down 0.56%, or ₹7.60, during the latest session. Despite the daily decline, the stock has gained 12.12% over one month and 2.54% in five trading sessions.
The company’s market capitalisation stood at approximately ₹18.38 lakh crore, with its shares trading at a P/E ratio of 19.40.
The stock has delivered mixed returns across different time periods. It is up 21.41% over five years but remains down 10.56% over one year.
| Period | Return |
|---|---|
| 1 Day | -0.66% |
| 5 Days | +2.54% |
| 1 Month | +12.12% |
| 6 Months | +1.62% |
| 1 Year | -10.56% |
| 5 Years | +21.41% |
Reliance Industries reported consolidated revenue of ₹3,36,394 crore for the September 2026 quarter, compared with ₹2,59,105 crore in the September 2025 quarter.
Net profit increased to ₹29,550 crore, against ₹22,092 crore a year earlier. EBITDA rose to ₹62,409 crore, while earnings per share stood at ₹18.88.
These figures indicate growth in revenue, operating earnings and net profit compared with the corresponding quarter.
Reliance Industries' technical indicators show strong recent momentum. Its RSI stood at 75.05, while the Stochastic RSI was at 100, both indicating overbought conditions.
The MACD reading of 10.18 indicated a bullish signal, while the ADX at 32.69 pointed to a strong trend.
Analyst sentiment was positive, with all 23 analysts covered in the supplied data recommending a Buy rating. No Hold or Sell recommendations were recorded.
Recent company announcements include investor meetings with institutional investors, including the CLSA India Forum and JM Financial India Conference. The company also published its September 2026 quarterly financial results on October 30, 2026.
Key Takeaway: Reliance Industries has recorded strong monthly share price gains and year-on-year growth in its September quarter revenue and net profit. However, overbought technical indicators suggest investors should monitor price momentum and volatility.
Loading chart...
| Metric | Value |
|---|---|
| Share Price | ₹1,359.40 |
| Daily Change | -₹7.60 (-0.56%) |
| Market Capitalisation | ₹18,37,718.76 crore |
| P/E Ratio | 19.40 |
| P/B Ratio | 1.96 |
| EPS | ₹59.69 |
| Book Value | ₹697.88 |
| EBITDA (Key Fundamental) | ₹2,07,911 crore |
| Dividend Yield | 0.44% |
| Return on Equity | 8.80 |
| Debt-to-Equity | 0.44 |
| Volume | 61,00,792 shares |
| Day's Open | ₹1,370.00 |
| Day's High | ₹1,373.00 |
| Day's Low | ₹1,354.50 |
| Previous Close | ₹1,367.00 |
| Average Price | ₹1,363.50 |
| Upper Circuit | ₹1,503.70 |
| Lower Circuit | ₹1,230.30 |
| 52-Week High | ₹1,611.80 |
| 52-Week Low | ₹1,152.20 |
| Period | Return |
|---|---|
| 1 Day | -0.66% |
| 5 Days | +2.54% |
| 1 Month | +12.12% |
| 6 Months | +1.62% |
| 1 Year | -10.56% |
| 5 Years | +21.41% |
| Particulars | September 2026 |
|---|---|
| Revenue | ₹3,36,394 Cr |
| Expenses | ₹2,73,985 Cr |
| EBITDA | ₹62,409 Cr |
| Operating Profit Margin | 17% |
| Depreciation | ₹15,315 Cr |
| Interest | ₹8,481 Cr |
| Profit Before Tax | ₹38,613 Cr |
| Tax | ₹9,063 Cr |
| Net Profit | ₹29,550 Cr |
| EPS | ₹18.88 |
| Particulars | Sep 2025 | Sep 2026 |
|---|---|---|
| Revenue | ₹2,59,105 Cr | ₹3,36,394 Cr |
| EBITDA | ₹50,367 Cr | ₹62,409 Cr |
| Net Profit | ₹22,092 Cr | ₹29,550 Cr |
| EPS | ₹13.42 | ₹18.88 |
| Particulars | Mar 2025 | Mar 2026 |
|---|---|---|
| Total Assets | ₹19,50,121 Cr | ₹21,78,140 Cr |
| Fixed Assets | ₹9,99,393 Cr | ₹11,24,795 Cr |
| Capital Work in Progress | ₹2,62,358 Cr | ₹2,37,686 Cr |
| Investments | ₹2,42,381 Cr | ₹2,48,332 Cr |
| Other Assets | ₹4,45,989 Cr | ₹5,67,327 Cr |
| Current Liabilities | ₹4,53,737 Cr | ₹5,41,254 Cr |
| Non-Current Liabilities | ₹4,86,758 Cr | ₹5,51,020 Cr |
| Total Equity | ₹10,09,626 Cr | ₹10,85,866 Cr |
| Reserves and Surplus | ₹8,29,668 Cr | ₹8,90,498 Cr |
| Share Capital | ₹13,532 Cr | ₹13,532 Cr |
| Particulars | Mar 2025 | Mar 2026 |
|---|---|---|
| Operating Activities | ₹1,78,703 Cr | ₹1,92,113 Cr |
| Investing Activities | -₹1,37,535 Cr | -₹1,01,089 Cr |
| Financing Activities | -₹31,891 Cr | -₹51,549 Cr |
| Net Cash Flow | ₹9,277 Cr | ₹39,475 Cr |
| Year | Dividend Per Share | Dividend Yield |
|---|---|---|
| 2023 | ₹9.00 | 0.61% |
| 2024 | ₹10.00 | 0.78% |
| 2025 | ₹5.50 | 0.41% |
| 2026 | ₹6.00 | 0.44% |
| Indicator | Value | Signal |
|---|---|---|
| RSI (14) | 75.05 | Neutral |
| ATR (14) | 27.95 | Volatile |
| Stochastic (9,6) | 91.16 | Overbought |
| Stochastic RSI (14) | 100.00 | Overbought |
| MACD (12,26) | 10.18 | Bullish |
| ADX (14) | 32.69 | Strong Trend |
| Ultimate Oscillator | 72.07 | Bearish |
| ROC | 17.35 | Uptrend |
| Williams %R | -3.16 | Overbought |
Technical Signal Summary: Bearish – 3; Neutral – 3; Bullish – 3.
| Recommendation | Percentage |
|---|---|
| Buy | 100% |
| Hold | 0% |
| Sell | 0% |
| Analysts Covered | 23 |
| Company | Market Cap (₹ Cr) | P/E | Revenue (₹ Cr) | Revenue Growth | Net Profit (₹ Cr) |
|---|---|---|---|---|---|
| Reliance Industries | 18,37,718.76 | 19.40 | 10,86,181 | 10.53% | 95,610 |
| Indian Oil Corporation | 2,02,385.59 | 4.10 | 7,88,578.40 | 3.54% | 43,677 |
| Bharat Petroleum | 1,30,936.10 | 8.40 | 4,58,526.80 | 3.52% | 25,843 |
| Hindustan Petroleum | 82,219.06 | 57.70 | 4,44,027.50 | 1.80% | 18,047 |
| Mangalore Refinery & Petroleum | 30,900.07 | 6.90 | 88,865.70 | -6.30% | 1,925 |
| Chennai Petroleum | 21,446.22 | 3.70 | 63,705.40 | 7.28% | 3,103 |
| Indicator | Reported Value |
|---|---|
| Revenue Growth | 10.53% |
| Net Income Growth | 18.35% |
| Cash Flow Change | 7.50% |
| ROE Growth Indicator | 10.00% |
| ROCE Growth Indicator | 5.40% |
| EBITDA Margin (Average) Growth Indicator | 2.52% |
Data Note: The source provides different values for quarterly and peer-comparison revenue and net profit. The peer comparison appears to use a different reporting period or calculation basis. These figures have been kept separate and should not be treated as interchangeable. Verify all figures against the official September 2026 financial results before publication.
Financial journalist specializing in market analysis, stock research, and investment trends. Dedicated to providing accurate, timely insights for informed decision-making.
Credentials: Experienced financial journalist with expertise in equity markets and economic analysis
The information provided in this article is for educational and informational purposes only and should not be construed as financial, investment, or legal advice. welomoney does not provide personalized investment recommendations.
For detailed terms and conditions, please read our Disclaimer and Terms of Service.

Welspun Living approves ₹3,200 crore capex in subsidiary WHSL, adding Terry Towel, weaving and yarn capacity, with completion targeted for December...
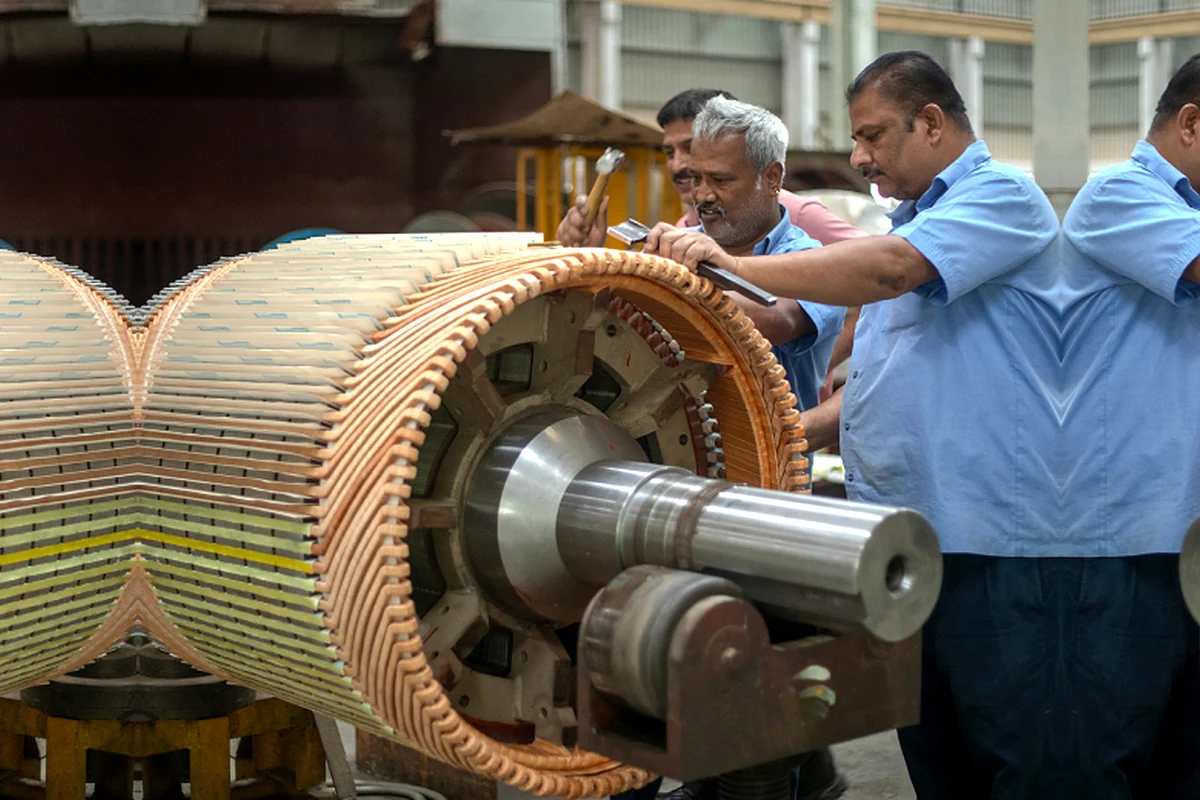
Kirloskar Electric shares trade at ₹104.70 after a 1.8% decline. Check Q2 FY27 results, ₹100 crore working capital facility, financials and technical...
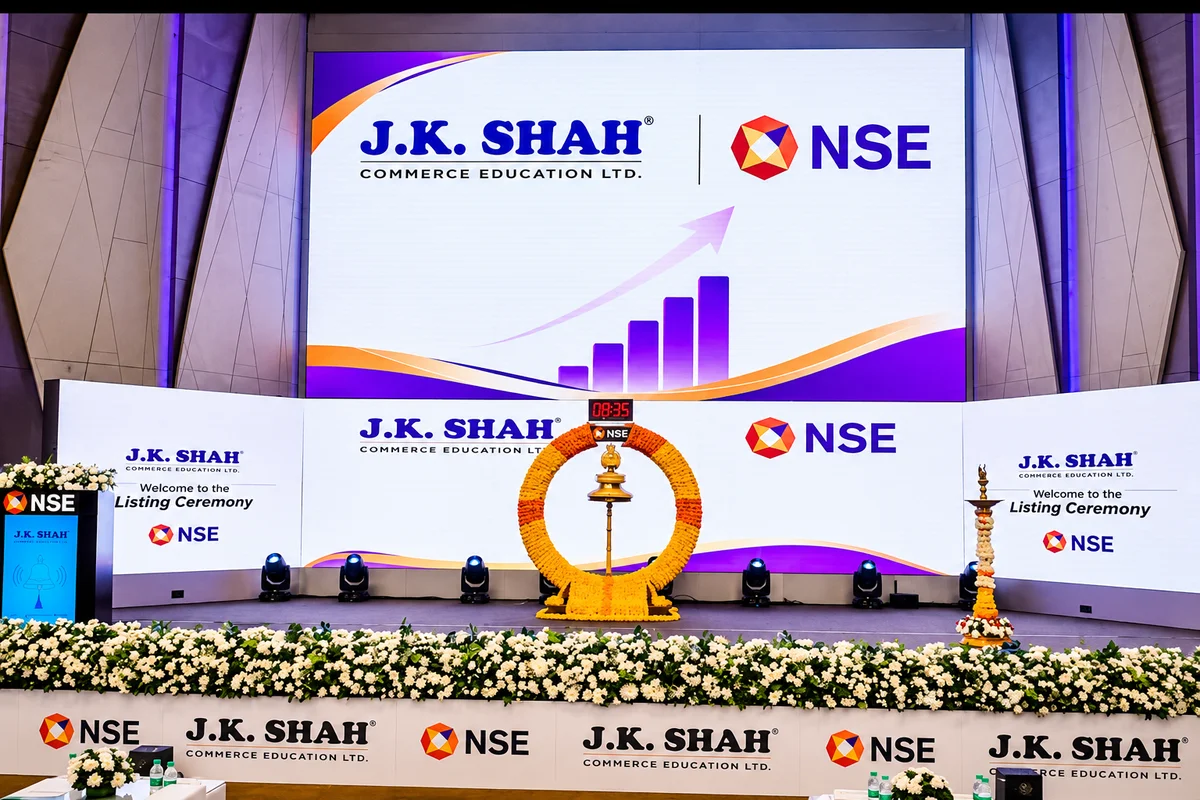
JK Shah Commerce Education shares fell 5% to ₹187.72 and hit the reported lower circuit. Check share price, Q1 FY27 financial data, filings and...

Samyak International reports Q2 FY27 revenue of ₹29 crore and net profit of ₹1 crore. Check its Panda Tech resolution, financial results and stock...
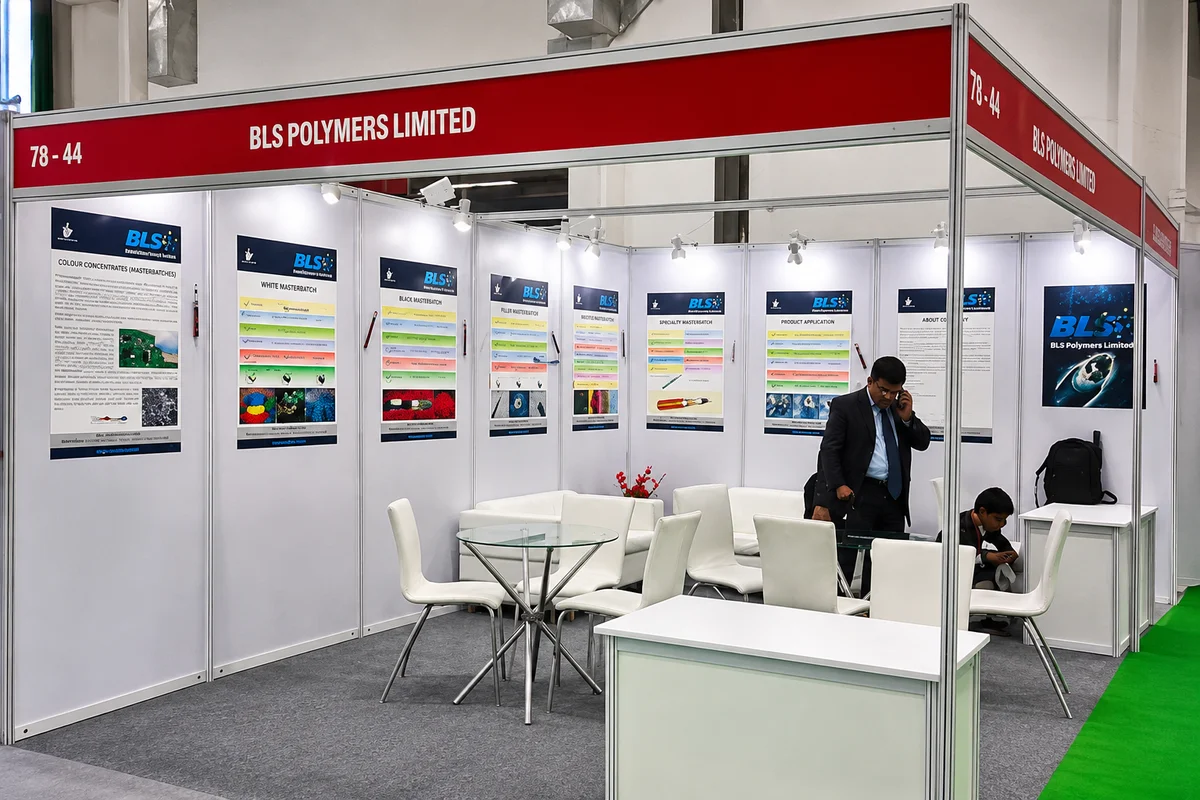
BLS Polymers shares fell 4.33% to ₹270.32 after an 81% rally. Explore FY26 revenue, net profit, EBITDA, Q1 results update, market data and technical...