Loading market data...
Sun, 22 Nov 2026
01:39:05 pm
Sun, 22 Nov 2026
01:39:05 pm

Rudransh Sangwan
Published at: November 20, 2026, 9:58 AM
Synopsis
Angel One shares gained 3.58% to ₹348.50. Check Q2 FY27 results, MTF revenue contribution, analyst ratings, technical indicators and share price performance.
Angel One shares gained 3.58% to ₹348.50 in the latest trading session, taking the company's market capitalisation to approximately ₹31,918 crore.
The stock has gained 15.29% over one month and 24.10% over one year, supported by improving recent price momentum.
Key share price movements:
Angel One touched an intraday high of ₹350.90 and a low of ₹331.35. Its 52-week trading range stands between ₹208.63 and ₹379.15.
Angel One's margin trading facility (MTF) business contributed 20% of its total income in Q2 FY27, according to a recent company update.
Other developments include:
Angel One reported improved consolidated financial performance in the September 2026 quarter compared with the year-ago period.
The figures indicate year-on-year growth in revenue, operating earnings and net profit.
Analyst recommendations remain positive. Refinitiv data covering 11 analysts shows:
The average technical reading is mixed, with three bullish, three neutral and three bearish indicators.
Notable signals include:
Investors will be watching MTF growth, trading activity, customer acquisition and upcoming financial updates to assess Angel One's business momentum.
| Particular | Value |
|---|---|
| Last Traded Price | ₹348.50 |
| Daily Change | +₹12.05 (+3.58%) |
| Market Capitalisation | ₹31,918.15 Cr |
| P/E Ratio | 26.70 |
| P/B Ratio | 4.63 |
| EPS | ₹10.09 |
| Book Value | ₹72.86 |
| EBITDA | ₹1,833.60 Cr |
| Dividend Yield | 0.71% |
| Return on Equity | 14.88% |
| Debt-to-Equity | 0.97 |
| Period | Return |
|---|---|
| 1 Day | +3.79% |
| 5 Days | +2.40% |
| 1 Month | +15.29% |
| 6 Months | +6.46% |
| 1 Year | +24.10% |
The supplied market data separately reports a 3.58% daily price change and a 3.79% one-day performance figure.
| Particular | Price |
|---|---|
| Open | ₹333.00 |
| Day High | ₹350.90 |
| Day Low | ₹331.35 |
| Previous Close | ₹336.45 |
| Average Price | ₹344.38 |
| Upper Circuit | ₹370.05 |
| Lower Circuit | ₹302.85 |
| 52-Week High | ₹379.15 |
| 52-Week Low | ₹208.63 |
| 3-Year High | ₹389.60 |
| 3-Year Low | ₹194.10 |
| 5-Year High | ₹389.60 |
| 5-Year Low | ₹99.05 |
Consolidated figures in ₹ crore, except EPS.
| Metric | Sept 2025 | June 2026 | Sept 2026 |
|---|---|---|---|
| Revenue | 1,204 | 1,434 | 1,432 |
| Expenses | 786 | 945 | 791 |
| EBITDA | 418 | 489 | 641 |
| Operating Profit % | 35% | 34% | 45% |
| Depreciation | 31 | 35 | 35 |
| Interest | 93 | 129 | 148 |
| Profit Before Tax | 294 | 325 | 459 |
| Tax | 82 | 93 | 124 |
| Net Profit | 212 | 231 | 335 |
| EPS (₹) | 23.39 | 2.54 | 3.67 |
EPS figures are reproduced as supplied. The sharp difference between September 2025 EPS and the later quarters should be checked against the company's filings and corporate-action-adjusted figures before publication.
Consolidated figures in ₹ crore.
| Particular | March 2026 |
|---|---|
| Total Assets | 23,904 |
| Fixed Assets | 505 |
| Capital Work in Progress | 10 |
| Investments | 257 |
| Other Assets | 23,132 |
| Current Liabilities | 17,603 |
| Non-Current Liabilities | 152 |
| Total Equity | 6,149 |
| Reserves and Surplus | 6,027 |
| Share Capital | 91 |
Consolidated figures in ₹ crore.
| Category | FY26 |
|---|---|
| Operating Activities | -4,142 |
| Investing Activities | -111 |
| Financing Activities | 3,656 |
| Net Cash Flow | -597 |
| Company | Market Cap (₹ Cr) | P/E | Revenue (₹ Cr) | Revenue Growth | Net Profit (₹ Cr) | Profit Growth |
|---|---|---|---|---|---|---|
| NSE | 5,52,420.05 | 49.30 | 18,713.40 | -2.42% | 10,180 | 22.83% |
| BSE | 1,54,363.73 | 50.00 | 5,148.10 | 59.07% | 2,475 | 44.97% |
| ICICI Prudential AMC | 1,46,399.37 | 41.20 | 6,000.90 | 20.51% | 3,298 | 6.09% |
| Groww | 1,40,371.72 | 51.50 | 4,815.90 | 18.57% | 2,083 | 53.77% |
| HDFC AMC | 1,16,008.57 | 38.70 | 4,622.20 | 13.84% | 2,858 | 4.22% |
| SBI Funds | 1,08,349.04 | 34.30 | 4,976.10 | 17.47% | 3,067 | -5.99% |
| MCX | 89,565.89 | 51.50 | 2,429.10 | 100.93% | 1,332 | 130.18% |
| Motilal Oswal Financial Services | 72,230.64 | 27.00 | 9,416.40 | 11.87% | 1,865 | 198.23% |
| Nippon Life India AMC | 67,102.00 | 41.70 | 2,933.10 | 16.36% | 1,528 | -5.86% |
| 360 ONE WAM | 49,343.34 | 41.30 | 4,477.30 | 21.52% | 1,216 | -4.88% |
Refinitiv data from 11 analysts.
| Rating | Analyst Share |
|---|---|
| Buy | 81.82% |
| Hold | 18.18% |
| Sell | 0% |
| Indicator | Value | Signal |
|---|---|---|
| RSI (14) | 61.25 | Neutral |
| ATR (14) | 13.77 | Less Volatile |
| Stochastic | 62.72 | Neutral |
| Stochastic RSI | 72.16 | Neutral |
| MACD | 1.73 | Bullish |
| ADX | 32.84 | Strong Trend |
| Ultimate Oscillator | 38.50 | Bearish |
| ROC | 8.39 | Uptrend and Accelerating |
| Williams %R | -45.07 | Neutral |
Technical summary: 3 bearish, 3 neutral and 3 bullish indicators.
| Year | Dividend Per Share (₹) | Dividend Yield |
|---|---|---|
| 2020 | 2.70 | 9.27% |
| 2021 | 12.86 | 8.37% |
| 2022 | 27.10 | 23.30% |
| 2023 | 39.85 | 13.09% |
| 2024 | 34.65 | 14.98% |
| 2025 | 48.00 | 21.10% |
| 2026 | 24.75 | 7.36% |
| Record Date | Corporate Action | Details |
|---|---|---|
| 22 Oct 2026 | Dividend | ₹1.40 per share |
| 15 Oct 2026 | Quarterly Results | Results announcement |
| 21 Jul 2026 | Dividend | ₹1.00 per share |
| 15 Jul 2026 | Quarterly Results | Results announcement |
| 27 Mar 2026 | Dividend | ₹1.75 per share |
| 26 Feb 2026 | Stock Split | 1:10 |
| 21 Jan 2026 | Dividend | ₹23 per share |
| Particular | Details |
|---|---|
| Company | Angel One Limited |
| Sector | Financial Services |
| Industry | Capital Markets |
| Parent Group | Raise Financial Services |
| Website | https://www.angelone.in |
Financial journalist specializing in market analysis, stock research, and investment trends. Dedicated to providing accurate, timely insights for informed decision-making.
Credentials: Experienced financial journalist with expertise in equity markets and economic analysis
The information provided in this article is for educational and informational purposes only and should not be construed as financial, investment, or legal advice. welomoney does not provide personalized investment recommendations.
For detailed terms and conditions, please read our Disclaimer and Terms of Service.
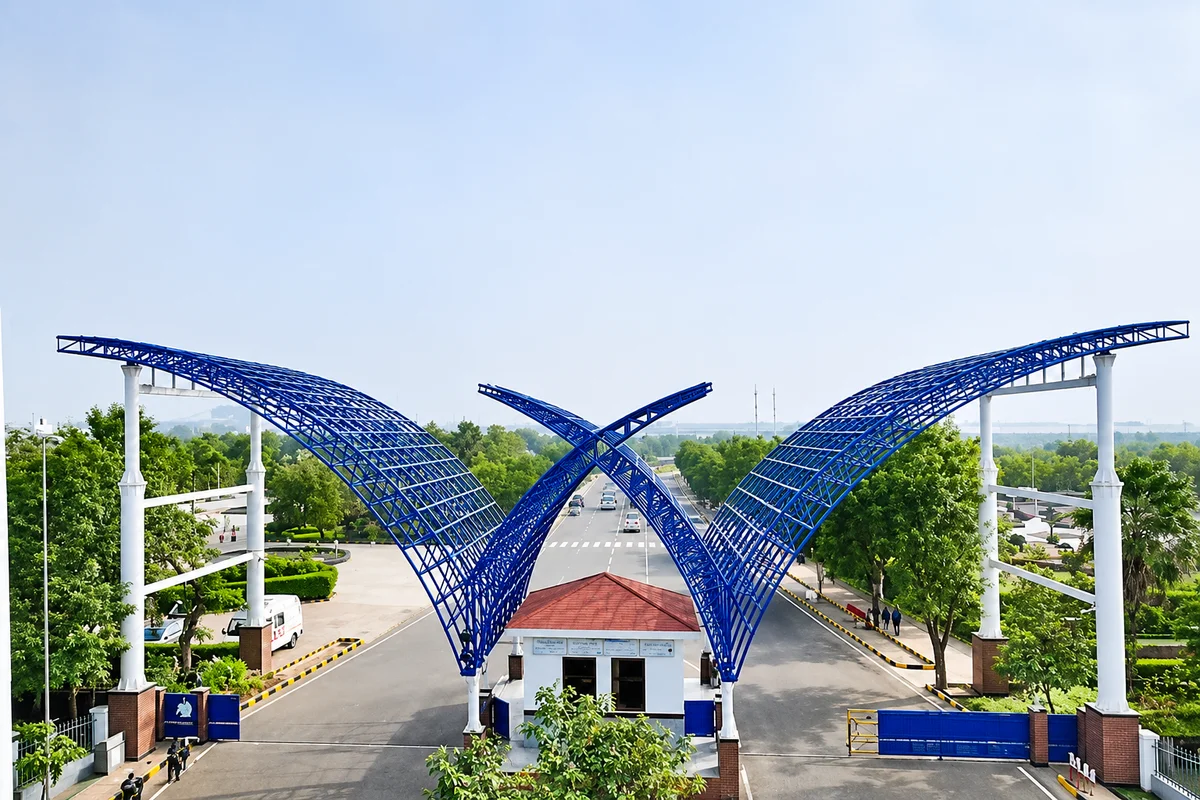
Welspun Living approves ₹3,200 crore capex in subsidiary WHSL, adding Terry Towel, weaving and yarn capacity, with completion targeted for December...
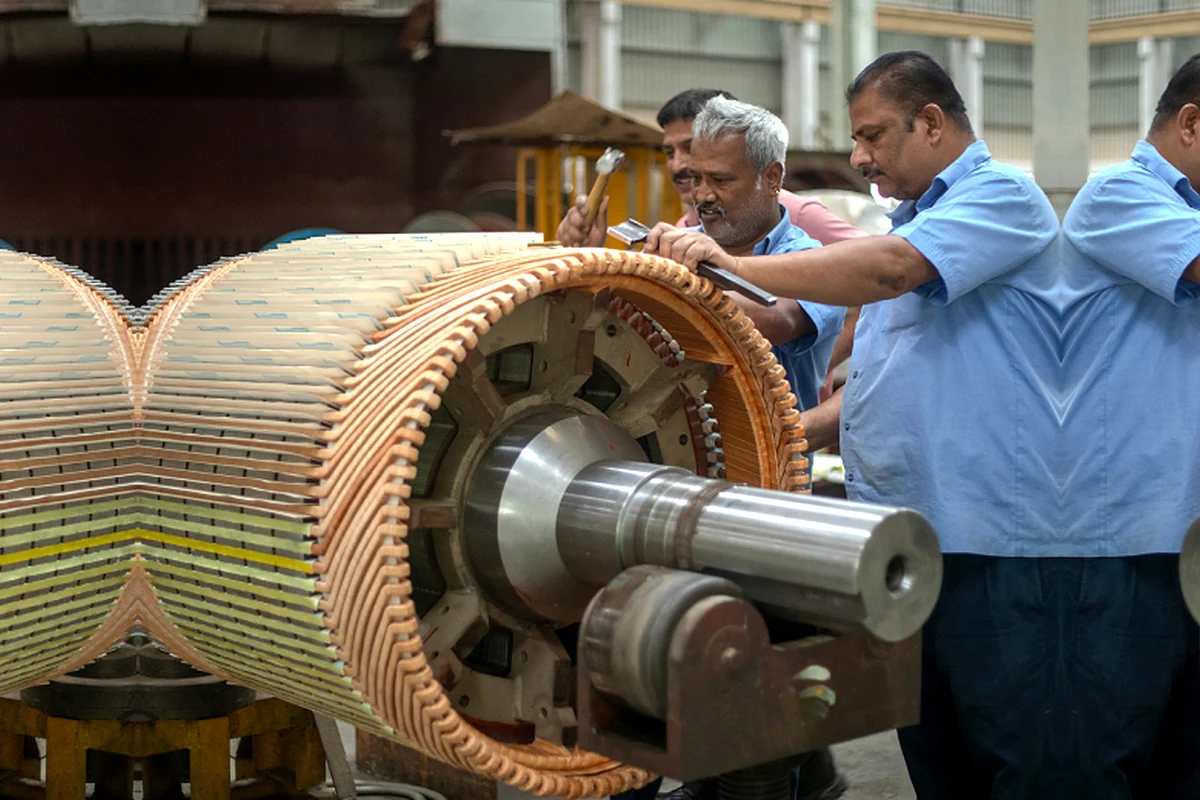
Kirloskar Electric shares trade at ₹104.70 after a 1.8% decline. Check Q2 FY27 results, ₹100 crore working capital facility, financials and technical...
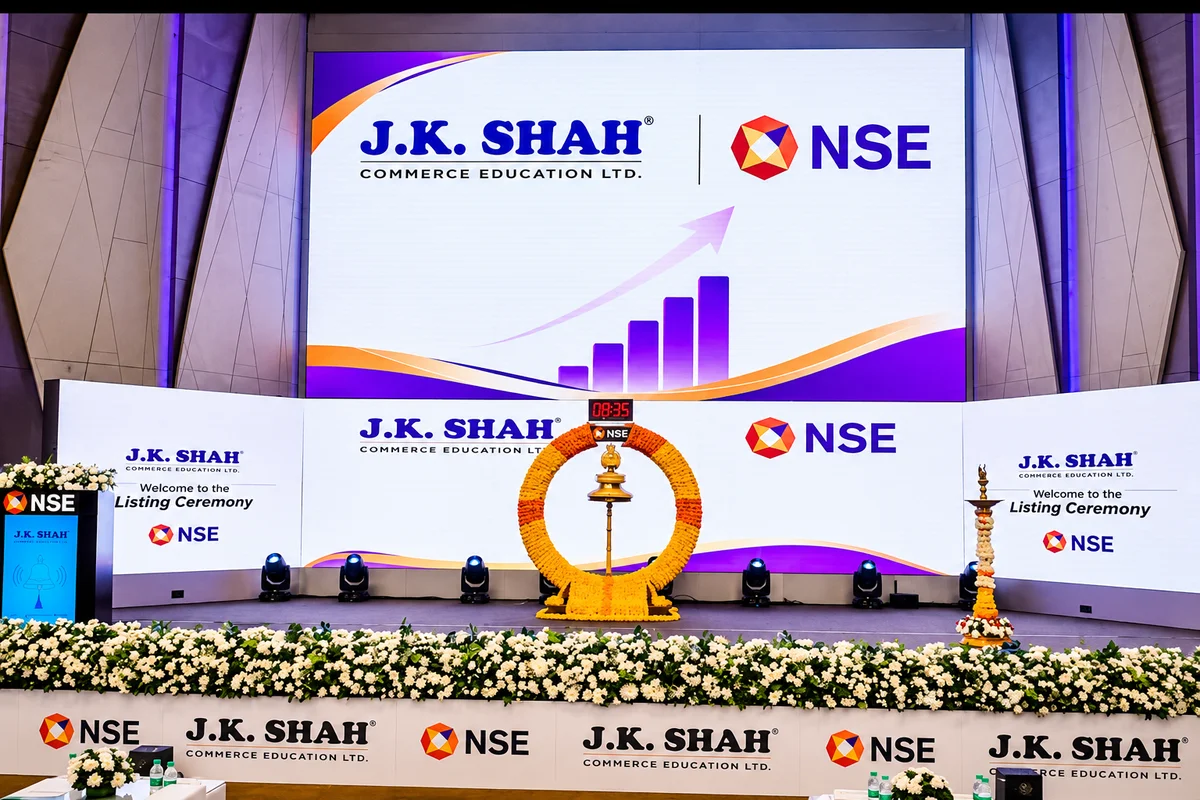
JK Shah Commerce Education shares fell 5% to ₹187.72 and hit the reported lower circuit. Check share price, Q1 FY27 financial data, filings and...

Samyak International reports Q2 FY27 revenue of ₹29 crore and net profit of ₹1 crore. Check its Panda Tech resolution, financial results and stock...
BLS Polymers shares fell 4.33% to ₹270.32 after an 81% rally. Explore FY26 revenue, net profit, EBITDA, Q1 results update, market data and technical...